There are many strategic planning consultants, each having their own model for how to best use strategic planning. Each of these planning methodologies has similarities and the differences. Those differences usually relate to the industry segments of the businesses and the company’s position as either that of a market leader or a new entrant. Remembering that this book is focused on innovation management, the types of business strategic planning that we’re talking about here is for companies where business growth is critical to success.

Traditional strategic planning is shown in “Contrasting Strategic Planning Methods” figure. This graphic contrasts traditional strategic planning with that of the seven “S” methodology which is focused on creating a strategic architecture for a corporation. Examining these two models, it is seen that the vision and mission are fully explored in the strategic architecture framework. As in the traditional strategic planning framework, the strategic architecture framework loos at leadership, culture and values, structural systems, and core competencies. Additionally, in the strategic architecture model one also thinks about (1) the quality of the intellectual leadership of the corporation (which we will discuss later in our human resources section), (2) the management of the migration path between what is today and the future, and finally (3) competition for market share.

A more detailed distinction between strategic planning and strategic architecture is provided by Hamel and Prahalad as shown in the “Strategy as Patient Money” figure. Although more detailed, the key differences between the two is that crafting a strategic architecture requires utilizing a much more expansive view of industry, technology, customers, and corporate staff.
Consulting companies have variants on these two approaches. They all involve thinking about a very high-level vision and mission which can include the intellectual capabilities that really identifies the potential of the corporation. This is often expressed as a unique point of view. As was seen in the previous sections on mission, vision, and values these can also incorporate a behavioral agenda. Almost all consulting entities’ work focuses on making new values and behaviors tangible. Some strategic plans also have a skills agenda which really is about building the core competency and leveraging capabilities. Others put this into the visions and strategy framework. Likewise there is usually an administrative strategy to provide the infrastructure to achieve the products and services that the company hopes to build. The strategy also oftentimes involves incrementally improving the core administrative processes.

Being pragmatic, the “Project Selection Criteria vs. Business Needs” figure shows how large companies go about developing a strategic plan once the core mission, vision, values, core competencies, and strategic intent have been defined. this process usually starts at the senior executive level. One knows the current market capitalization of the company from the shares outstanding and the stock price. From stock market analyst expectations the expected stock price over years to come can be derived. Assuming that the overall corporate returns will be at the same return on sales as today, one can calculate from the analyst expectations the revenues required per year over the next decade. This would be the uppermost line of the graph embedded in the “Project Selection Criteria vs. Business Needs” figure.
Analysis of this graphic allows the senior management team to look at the upper line of revenues over years (according to what the analysts are expecting) and compare that viewpoint to their own internal viewpoint, and see whether those expectations are going to be met or not. It is no surprise that analysts’ expectations usually exceed what a company can reasonably expect to obtain. Large companies then look at the operating strategic plans of the existing business units. These plans are the ones shown in green box and in the lower triangle of the graph. This organic sustaining, incremental, or Horizon one work (depending on industry jargon), can be predicted with a high degree of certainty. Growth that comes from initiatives such as new products, services, geographic expansion, management changes, and operational improvements causes the green shaded area to increase over time. The result of such efforts usually fills in the gap, making the “miss” to analysts’ expectations smaller.
However, this often still leaves a significant amount of revenue growth yet unaccounted for, particularly in the out-years. The next step for senior management team is to then look at how one can fill the remaining gap with next-generation, Horizon 2, or translational and transforming new products and services. This growth is often forecast by new business development groups, long-range R& D groups, venture groups and specified corporate initiatives. This work is shown by the blue box and blue shaded area in the Figure. What typically happens is again the gap has narrowed. But as we see in the “Project Selection Criteria vs. Business Needs” figure there is unfortunately still a small gap yet to be filled.
The last gap is in the Figure is usually assigned to a breakthrough, Horizon 3, scope-change or step-out business development or venture group work.
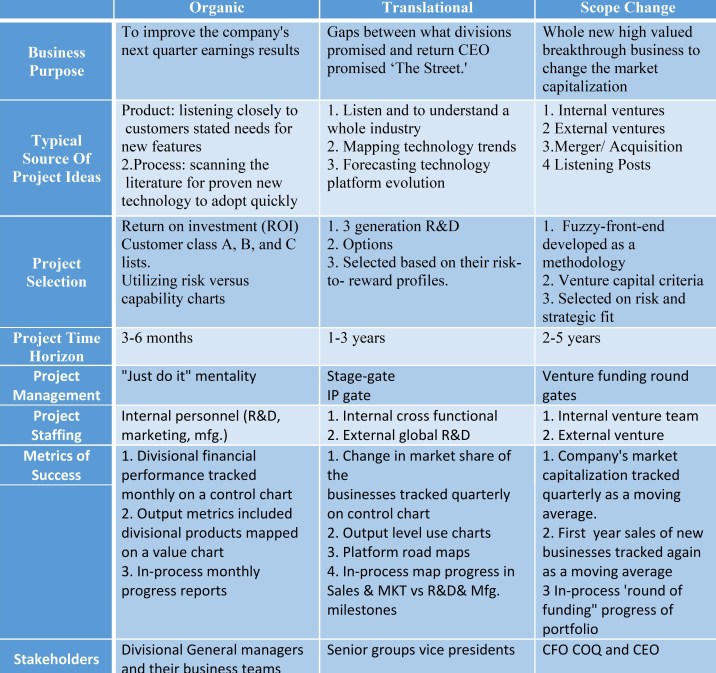
Planning in this manner is extremely helpful for those involved in innovation management. Looking at the business needs according to what is required to meet analyst expectations sets the stage for purposeful strategic planning. The reason these three time horizons helps so much in strategic planning is shown in the “Project Selection Characteristics” figures.
These tables show how the organic sustaining work is really focused on improving the company’s next quarter’s earnings and results. The translational or transforming work really allows the CEO to deliver performance consistent with analysts’ expectations over a 3-5 year time horizon. The final scope changing work provides highly valued breakthrough businesses that will really change the market capitalization of the corporation in the many years to come. These Figures show the typical source of project ideas for each of these three areas, the project selection criteria, the projects’ likely time horizon, project management methods, project staffing quantity and type, and the projects’ measurement of success.
Knowing that strategic planning from an innovation management standpoint can be broken up into these three broad categories allows one to use the appropriate strategic planning methodology for each of these three areas. Many times this distinction is not made clear to a management team and a single methodology is used to solve both the need for a grant organic translational and scope changing growth. This results in a strategic plan that is unfocused and unlikely to yield optimal results.
You must be logged in to post a comment.