Program and Project roadmaps are constructed so that both the optimal as well as competing efforts can be seen. It’s important however to superimpose on these roadmaps integrated view that looks at other elements as shown in the “Integrated Road-maps” figure. (Note: figure repeated).

In addition to these elements showing an integrated view of the landscape it’s important to consider whether or not a project when undertaken would be able to sustain an advantaged position. It’s also important to understand whether there will be freedom to operate if a product is developed. Ways to combine what a consumer will see and experience (by way of relative product performance) versus what manufacturing and the company will experience (by way of its costs) is shown in the “Integrated Intellectual Property Performance Versus Cost Diagrams” figure. Superimposed on this bubble diagram are color-coded boundaries. These indicate whether areas of already been fenced off with patent fences. Red boundaries indicate the field is closed and that entry will be extremely difficult because of an existing intellectual property position of another. Orange means that the area is constrained by existing patents and it will be difficult but possible to enter. Green means that the area will be open for another company to introduce a product and likely be able to sustain its advantage position with new patents.
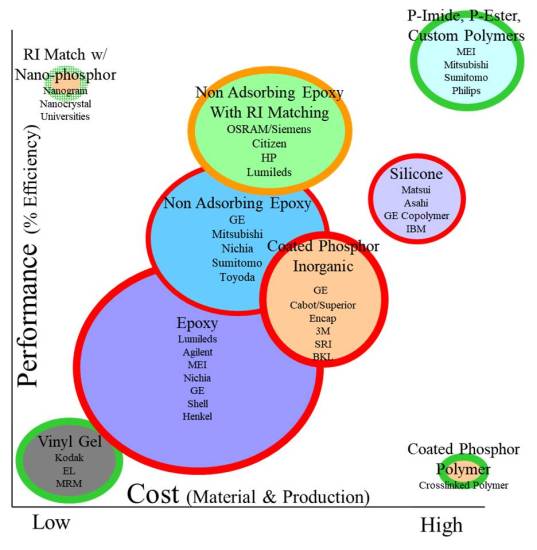
In the “Integrated Intellectual Property Performance Versus Cost Diagrams” figure the technology performance is shown on the y-axis position. These are the performance attributes that a customer will see and experience. The x-axis shows the business position by way of the costs that it will take for a company to bring the product into a consumer’s hands.
This particular figure your approach is located in the central regions of the mapper can have IP issues. This is mostly because of the intellectual asset management sophistication of one key player which is locked out these positions are many buddy else being able to compete in this area. This leaves only the four corners is open areas for new research project. Depending upon the company’s market branding and positioning they have a choice of either being in the high-performance high-cost area, the low performance low-cost area, or entering the high-value area with brand-new technology in the upper left.
You must be logged in to post a comment.