
Technical Processes
- Why Bother Structuring and Managing Technology?
- Benchmarking Best New Product Development Practices
- Types of R&D Project Practices
- Global Innovation Project Practices
- Organizational Structures for Managing Technology
- Valuing Technical Projects: DCF, Options and Other Methods
- Sources, References and Selected Bibliographic Information
——————————————————————————————-
Why Bother Structuring and Managing Technology?

The desire to structure innovation processes is driven by the attrition of NPD projects as they proceed toward commercialization, see the “Attrition of New Business Development Project” figure. On average it takes between 1-3000 ideas to create one commercially successful product. This low success rate has prompted much research on methods to improve NPD processes.

Because the success rate is so low there is considerable pressure to improve its efficiency by using structured best-practices. This of course is a worthwhile objective but unfortunately the tendency in R&D organizations is to structure all processes to the same degree. This is faulty logic as in the innovation process contains several steps that are processes in of themselves. Some process steps are straightforward and others have many feedback loops. The process rarely resembles a funnel diagram that is often used illustrate R&D processes, especially with respect stage and gate methodologies. An example of the complexity is shown in the “Complexity of the Innovation Process” figure.

Current consensus among best practice R&D leaders is that early stages of the R&D and ideation process be guided by high-level objectives and the work itself left unstructured. In contrast later steps in the commercialization process that consist of planning, manufacturing scale up, and consumer issues benefit from structured organized work processes that guide actions of individuals and functional groups. This is been reported by Perry Norling of DuPont in ChemTech, October 1997. Similar work done by a A.L. Page, done by surveying hundreds of organizations and reported in a paper presented at the PDMA conference in Chicago of 1991, shows the historic attrition curve was similar (see the “Historic Attrition Curve of NPD Projects” figure). The business need for improvement and appropriate structuring of R&D and NBD processes is overwhelming.
Benchmarking Best New Product Development Practices
Low overall R&D project commercialization rates prompted Robert Cooper and others to start benchmarking NPD best practices. These were reported in Research Technology Management, February 2004. In their studies they listed 17 best practice topic areas going all the way from ideation through to commercialization. In this work 113 measures were studied across 105 business units. When separating the best from worst performers they found that three key areas heavily influenced the rankings. These were (1) the culture and climate within the business and support product innovation, (2) the role of senior management behaviors engagement and commitment, and (3) the nature of project teams and how they are organized.
Having an innovative climate is seen as one of the more important drivers of successful product development. There are seven components of this attribute of new product development. These are:
1. A supportive climate for entrepreneurship and product innovation. The supportive climate is a major difference between best and worst performers.
2. Rewards for champions. The majority of best performers recognize and reward their new product development leaders and entrepreneurs. This is both financial and nonfinancial recognition.
3. Rewards for project teams. When a project team does a good job on its product by getting to market on time in meeting its sales revenue targets is rewarded and recognized. Again this is both with financial and nonfinancial recognition.
4. Understanding of the business is new product development process. Worst performers employees do not understand or support the business is new product development process. Sometimes this is a result of a lack of training, lack of leadership, or simply a negative are skeptical attitude within the business.
5. Open communication. Best-performing businesses provide for open communication among the employees across functions, departments, and locations. This is found to stimulate creativity and permits more effective cross functional communication on project teams.
6. Risk adverse this. Best performers appear far less risk adverse. They are not afraid to invest more inventors and projects, with almost one third opting for riskier projects versus weak performers.
7. No punishment for failure. Removal of fear of failures particularly evident in best performers and indeed in most businesses studied. This encourages more innovative and risk-taking behavior although this should not be confused with lack of accountability.
The second climate and culture factor contains more action oriented items and specific programs designed to promote a positive climate. In descending order of impact they are:
1. Resources available for creative work. Best performers provide support and resources for creative employees to pursue your own projects. This includes seed money, equipment, and access to outside consultants.
2. Skunk works in unofficial projects are encouraged. Best performers encourage unofficial or underground skunk works projects.
3. Time off or scouting time. Many best-performing businesses provide creative employees with resources and time off to work on their own projects. This includes companies that allow between 10 and 20% free time to investigate projects of an employee’s own choosing.
4. New product ideas are rewarded. Best performers often provide rewards recognition to employees who submit new product ideas. Again these include both modest monetary and nonmonetary rewards.
5. A new product idea suggestion scheme is in place. This is a common practice amongst best performing businesses although this particular practice is weaker than those above in generating successful projects.
The third important area in successful new product development relates to senior management practices, roles and commitment to new product development. Senior management must lead the way new product development. Elements in doing so are:
1. Senior management providing strong support, empowerment and authority to the people working on new product development projects. This is a key driver of performance. This in particular includes FaceTime between top management and project leaders.
2. New product metrics are an explicit part of senior management’s personal and annual objectives. This includes a percentage of sales or profits coming from new products as part of a senior manager’s annual performance objectives. It is a number two discriminator between best and worst performers.
3. Senior management understanding of the business is new product development process. Management must understand their business is new product development process and be particularly aware of their own warrior role and responsibilities. The worst performers have senior management that does not understand the new business development process at all.
4. Senior management engage in the design of business is new product development processes. Having senior vice presidents of technology, marketing, sales etc. involved in designing key criteria and agreeing on a set of rules of engagement around behaviors was key to making the process successful.
5. Keeping score. Measuring new product results each year is a significant discriminator between best and worst performers. Examples are percentage of sales or profits achieved, percent success versus failures, on-time performance, etc.
6. Senior management strongly committed to new products and product development. This is the second strongest rated area overall and tighter the second-most prevalent among best performers.
7. Senior management not micromanaging new development projects. It leaves the day-to-day activities and decisions to the new development project leader and team. Senior management is involved in setting just the high-level objectives and providing high-level support.
8. Senior management involved in the go/no-go and spending decisions for new projects. Senior managers have a central role in the project review process.
It was also found that the way new product development team project teams are organized influenced the degree of success they had. These organizational attributes fall into three areas. These are (1) the way the teams are organized, (2) the cross functional nature of the teams, and (3) team accountability.
The ways in which teams are organized in order descending order of importance are:
1. The project team remaining on the project from beginning to and it not just on the project for a short while are single phase. This practice also enhances project team accountability.
2. A clearly assigned team of players for each significant new business development project, people who are part of the project and do work for it. Said another way projects have to have clearly assigned project teams.
3. A clearly identified team leader in charge responsible for driving the project.
4. The project leaders responsible for the project from the idea through to launch, carry it through the entire process rather than only for one or two stages. In this way accountability is enhance key knowledge is retained in project momentum is maintained.
The other factors that characterize the business development project teams including the cross functional nature of teams and team accountability are listed below in descending order of impact:
1. Project teams accountable for their projects end result. An example is the project teams are accountable for ensuring that the projects meet profit revenue and time targets. Team accountability is a pivotal best practice, and indeed strongly separates best from worst performers by a factor of 8:1.
2. Decisions made outside the team are handled efficiently. These can include such items as building the capital appropriations reap quest into the gate meeting rather than having it be a separate committee meeting. Another example is requiring all key decision-makers to 10 gate meeting so the project leaders do not have to run around seeking signatures afterwards one by one.
3. Sharing information among the project team members via central information system. The centralized communication system permits sharing project information. It allows several team members to work concurrently on the same document, even across functions locations and countries.
4. Cross functional cooperation of the team. Specifically this includes not wasting too much time on politics, conflicts, interdepartmental prejudices, etc. This speaks to having cross functional senior managers working well together. If this is a weak area it’s critical to provide team training on how to be a team member. This reduces the opportunity for conflicts in the introduction of office politics.
5. Cross functional project teams, with team members from technical, sales, marketing, operations, legal etc. Although this is a fairly common practice is worth mentioning because leaving out a cross functional area can severely detract from project success.
Putting the above best practices into place in many companies was done during the 1990s and early 2000’s. When doing so some areas were more easily addressed and implemented than others. As a result of auditing work done by Price Waterhouse on a number of companies revealed common strengths, weaknesses and recommendations for improvement. Thirteen common recommendations which Price Waterhouse made to organizations trying to improve their new product development efforts are listed below:
1. Develop a corporate strategy that includes clear understanding of the company’s core competencies. Defined the processes, responsibilities, and time frames for developing and managing business and technology strategies, and for ensuring that those strategies set the context for managing all new product and development activities.
2. Establish ongoing communications to create awareness of strategies, priorities, and product technology roadmaps throughout the company. Such communication should make it clear how these plans affect individual performance expectations, valuations, compensation, and rewards.
3. Institute a concepts submission process designed to cultivate a high-quality flow of new product ideas, and to enable management to evaluate those ideas based on their strategic relevance and projected value contribution.
4. Establish clear responsibilities, processes, and expectations for making new project selection decisions.
5. Establish simplified business and R&D portfolio management approaches to support new project investment decisions and the rationalization of ongoing product lines.
6. Implement total cost accounting for better decision-making and product line planning.
7. Establish a technology program to keep major innovations off the critical path of product development.
8. Establish a project management approach that combines flexible phase gate techniques while clearly distinguishing between the responsibilities of the project team and top management.
9. Avoid R&D project overload by reducing parallelism and projects.
10. Use metrics selectively to support improvements in R&D effectiveness.
11. Strengthen product development with early manufacturing involvement, systematic feedback from manufacturing, and design for manufacturability.
12. Improve manufacturing yields, streamline the product introduction process, and formulate an optimal outsourcing strategy.
13. Create mechanisms to ensure that the ongoing management of intellectual property is integrated with the business and technology strategies, and the relevant assets are developed, protected and leverage to maximize their value to the company.
Types of R&D Project Practices
Before moving on to the best ways to manage technical projects it is helpful to divide them into several categories. Many classification schemes exist that is the generally accepted breakdown is divide R&D and new business development projects into three main types.

The “Types, Categories or Horizons of R&D” figure shows attributes of the three main types or categories of R&D. To make sure the terms are clear Category 1 R&D is sometimes also referred to as Horizon 1 or incremental R&D. Category 2 R&D is also referred to as Horizon 2 or next-generation R&D. Finally Category 3 R&D is referred to Horizon 3, radical, or breakthrough R&D.
The purpose of making these distinctions is that management of technical projects varies depending upon which category they fall into. Category 1 projects generally include product and process improvements. They also include product line extensions. Implementation excellence is the driver for these types of projects. PERT and GANTT management methods have been shown to have the most productive best-practices for caring them out. For Category 2 projects which typically include new product and process developments, the best methods for caring them out include stage gate management methodologies. Category 3 projects are best carried out using fuzzy front-end methodologies. Because of the frequency that business needs new products in the business need to be different from competition most effort has been gone into understanding technical processes related to Category 2 programs. This will be addressed after a short section on Category 1 programs.
Horizon 1: Incremental Project Management Practices

There are many books on the use of PERT and Gantt charts to manage incremental type projects. The trick to success for these projects is to push them through to completion in short periods of time and with little overhead. One of the most elegant methods of managing and visualizing such project progress was developed by Clark Campbell and his One-Page Project Manager. The “The One-Page Project Manager Spreadsheet” figure shows how the one-page Project manager tracking system is laid out. It covers the five basic elements of a project. Those are the tasks; the how of a project. The objectives; the what and why of the project. The timeline; the when of a project. The cost; the how much of a project. And finally the owners; who’s responsible and accountable.
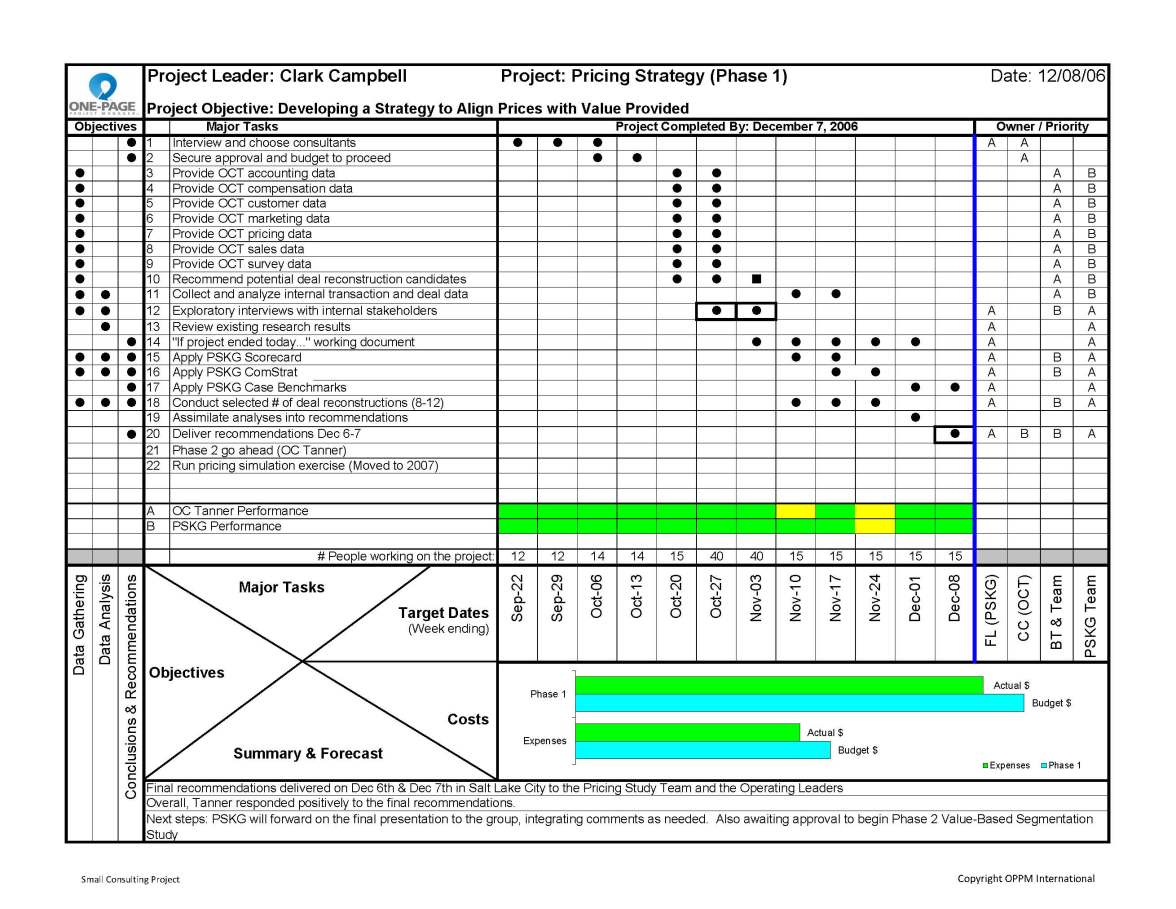
Filling in the five parts of the template creates an elaborate integrated PERT and Gantt chart that quickly shows the project leader, project team members, and management the status of all the elements they need to know about the project. Color coding of elements that are ahead and behind schedule, or above or below cost targets, makes opportunities and threats to the project quickly visible. The “An Example One Page Project Manager Project” figure shows an example project as displayed on the one-page template. Clark Campell’s book is a quick easy read and walks through all elements of incremental project management.
Horizon 2: Next-Generation Project Management Practices
Before jumping into newer Next-Generation State and Gate or Agile/Lean project management practices it is important to recognize older practices that are both great references and the building blocks for newer practices to build upon. The work of Steele in the book Managing Technology and Robert Szakonyi in the book How to Successfully Keep R&D projects on Track are both worth reading for someone interested in building their own solid foundation of issues and solutions to managing technical projects.

The State and Gate process was developed because the previous method of developing new products was typically linear and handed from functional silo to functional silo until the project was completed. This created high costs and little if any iterative learning. A sample process from a large chemical company is shown in the “NPD Process Prior to Stage and Gate Methodologies” figure.
Stage and Gate Practices for New Product Development

During the 1990’s and through the 2000’s, “Winning at New Products” by Robert Cooper has served as the bible for product developers everywhere. In his book, Robert Cooper demonstrated with compelling evidence why consistent product development is so vital to corporate growth and how to maximize your chances of success. Cooper outlined specific strategies for assessing risk, marshalling the appropriate resources, engaging customers in the pre-development discovery phase, evaluating your project portfolio, ensuring true cross-functional collaboration, and, most importantly, applying a rigorous process for making sound business decisions at every step-from idea generation to launch. This methodology has now been followed by thousands of companies worldwide. The “Overview of a Generic Stage Gate Process” figure shows an overview of a generic stage gate process.
From this overview of the stage gate process the next step is to implement the methodology. As always the devil is in the details. For a good discussion of those devilish details, the chapters in Technology Management: Case Studies in Innovation, edited by Robert Szakonyi, are a great resource.

When starting the project an Initial Screen Gate 1 Review is held based on a project request form provided by any party. This may be an inventor, technologist, marketing or sales professional, manufacturing for strategic planning person, etc. Typical questions needing answers to pass the Starting Gate 1 Review, using brief simple answers or best guesstimates, are shown in the “Initial Screen Gate 1 Review Questions” figure.

Once a project is started it is managed by providing the project team a set of activities to conduct, with the objective of appropriately answering the questions related to the next design review or Gate in this management process. Generalized activities are shown in the “Overview of Specific Project Stage Activities” figure and general questions for each stage/gate are shown for one company in the following “Example of General Gate Questions” figure.

Companies have customized the specific project activities and gate questions to both match their business environment and management appetite for getting into the weeds of project management. It is at this level that problems with the State and Gate process develop. Many times a company decides that the success rate of new projects is too low and that the solution is more management oversight. This is often a mistake. “It is the last act of dying organizations to create a new enlarged edition of a rule book for doing things right” (adapted from G.W. Gartner in his book The Individual and the Innovative Society). That said, the ”Example Stage Activities” figure is provided as an example of activities a company might choose from when designing the activities for its own Stage Gate process.


The “Project Leader’s Process Flowchart for Preparing for a Project Gate Review Meeting” gives a guide to prepare for a review and the ”Example Phase and Review Questions” figure provides, as an example, questions a company might choose from (when designing the questions to be addressed during its own Gate review meetings).


Stage and Gate Practices for Knowledge Building Projects


The stage and gate methodologies described above work well for next generation products and services developments. As can be seen from the detailed gate questions being asked above, there are times when a next generation project is initiated which relates to building technical or market capability. In this case the stage gate process applies a heavy overhead burden to projects. As such, some companies have built a stage gate light for such a knowledge building project. An example of the questions to be asked and answered at different Stages and Gates of a knowledge building project are shown in the “Knowledge Building Project – Overall Process Flow”, “Knowledge Building Project – Overall Phase (Gate) Review Questions” and “Knowledge Building Project – Detailed Phase (Gate) Review Questions” series of figures. These are meant to be exemplary examples that would be tailored to a specific company’s needs.

It cannot be emphasized enough that it is important to use the stage gate process to productively manage technical programs. Technical leadership has to be careful not to make filling out stage gate forms too burdensome. There are companies were this has happened. In these cases the goal switched from completing a commercialized product and generating revenue for the company to just filling out forms to get get a project through the stage gate process. Paperwork doesn’t generate customer sales, products do!
Six Sigma Project Management Practices
In the early 2000’s a program which had improved manufacturing operations performance and reduce their costs was called Six Sigma. These efforts were focused on reducing the variability in manufactured products and to some extent services. By improving the quality of such products and services the company experienced superior financial performance. There were several conferences in the early 2000s in which black belt Six Sigma instructors worked on implementing Six Sigma principles in R&D.
Six Sigma is a highly disciplined quality process to systematically limit defective performance to 3.4 defects per million parts. What was found was that Six Sigma in R&D can either be a disaster or an excellent path towards increasing research capability. Early adopters of the methodology were ABB, AlliedSignal, American Express, Bombardier, Crane, DuPont, General Electric, Lockheed Martin, Motorola, Polaroid, Raytheon, Sony, and Texas Instruments.
However, because of the spotty performance of the initiative, the movement never became mainstream in R&D. What has been implemented however is the use of Six Sigma principles in the normal stage gate process. Successful use of Six Sigma principles relies on understanding during the stage and gate process the (1) impact of potential killer variables to commercialization, (2) the market’s key drivers, (3) the market size, (4) key customers, and (5) customer needs. To understand such variables Six Sigma practitioners focus on assessing the specifications and in particular validating the measurement system of key attributes so that the measurement system is capable of knowing whether or not the product design and manufacturing process will be able to meet the specifications. This means defining the performance objectives of both the product and manufacturing process in detail, documenting potential inputs, and analyzing sources of variability during the R&D development and scale up phases. It also means going the extra mile during scale up to determine the process capability, implementing process controls, and careful documentation of what is learned. The Six Sigma process makes full use of process maps and metrics, cause-and-effect matrices, capability analysis, design of experiments, multivariable analysis, hypothesis testing, failure mode and effects analysis, mistake-proofing, and control plans. See the reference section of this chapter for more details.
Design for Six Sigma improved the quality of thought during R&D gate reviews for manufactured products in particular. A key learning is that it is extremely useful in R&D organizations to include team members on R&D projects who have a excellent understanding of manufacturing statistical process control methodologies.
Post Project Reviews
Post project reviews, sometimes called postmortems, are opportunities to improve performance and subsequent R&D projects. Unfortunately most companies have not established a structured approach to learning from projects after their completion. Those companies that neglect post project reviews as a tool for systematic inter-project learning, throwing away invaluable potential insights for competence building.
How a post project review is conducted depends on a number of factors often beyond the sphere of influence of the reviewers. These are things such as the size of the project and the team, the significance the project for the success and image of the company, the project management style and the team leadership, etc. The following is a list of what many people consider successful review practices. Max von Zedtwitz, in his paper on Post Project Reviews in R&D, provides a post-project process model that helps R&D learn from its mistakes. His guidance on how to conduct post project reviews is shown described below.
- Run the post project review like a mini project: set a goal, allow for creativity and person input at the beginning, then apply discipline to the funnel towards a tangible output at the end.
- Have a trained independent facilitator run the meeting: this allows the key project members to focus on the review results while the facilitator adds neutrality, process experience and review techniques. Outside facilitators can also uncritically identify the 4 principal review problems and address them more effectively.
- Ensure that the team is prepared for the review meeting. This pre-review work includes questions about the project itself and can be complemented by requests for the most unusual or surprising artifacts or observations from the project.
- Select the right environment and the right time for the review meeting. Off-site meetings reduce interruptions frp, day-to-day work and offer more opportunities for informal communication. If the review is held on-site, limit the duration to half a day and break to review into 2 meetings if necessary.
- Invite key stakeholders of current and selected future projects. Include managers and engineers, as well as key customers, marketing and sales people and, last but not least, the project administrator or department secretary.
- Produce a summary document. This is written report should not stop at enumerating general project problems but should focus on concrete solutions, warnings and recommendations for subsequent teams. Assign responsibilities for taking action on these recommendations.
Agile / Lean Project Management Practices
To do well at innovation, companies need to design their internal processes to engage in three activities: (1) facilitating serendipity to create sparks of creative ideation among the employees, (2) capturing and testing the outputs of this creative ideation, and (3) transforming new ideas into successful products and services. It was John Seely Brown who first created the notion of finding the Architecture of Revenues that lie at the heart of what turns R&D labs from hotbeds of creativity and invention into hubs of innovation. Business models are the connector between new technologies and commercial success.

The Stage and Gate Model has many benefits but fundamentally it utilizes the processes shown in the “Waterfall Model” figure. The stage and gate model also tends to reside within organizations that are quite siloed. The siloed specialist departments are sales, finance, marketing, operations, and technology. The people who work in these departments collaborate via memos, handoffs and an annual budgeting cycle. New projects within such companies require a business case with five-year projections of profits and ROI.
The problem with ideation in such companies is that upon coming up with an idea, inventors are immediately confronted with business planning. Anyone with an innovative idea has to make a financial case as to why the idea might succeed. Horizon 2 and Horizon 3 innovation is about imagining the future. The proposed business models are often very different from the company’s current models. As such senior management will not have seen the projected financials play out before and their unfamiliarity makes them critical judges of new projects.

The agile method differs and is built upon the concept of “Ba”. This is a Japanese concept in which knowledge is converted from tacit to explicit and back again, in a cycle that has four parts as shown in the “Spiral Evolution of Knowledge Conversion” figure. In this model an individual usually starts in the Internalization Quadrant of the lower left. In this quadrant the person is takes explicit knowledge that he or she knows and by thinking about it converts it into an ill formed idea of what might be (tacit knowledge). The cycle typically continues by a two people working together and talking about the idea, building and expanding upon their tacit knowledge. When a number of individuals get together and propose a project to do, the thought process moves into the upper right quadrant where Externalization occurs. The knowledge they have is converted into a business and/or project plan to try out their idea. In the lower right quadrant the project plan is executed, market feedback is received, and the resulting explicit knowledge is looked at again by an individual thinking about what was learned and what might be done differently. This cycle repeats itself over and over. From studying this knowledge transformation model Agile product development processes were developed. Business and product development does in fact follow a similar cycle of cycles. The waterfall model has the deficiency of not taking into account these cyclic tendencies.

To solve this problem it is important that management use different tools to inform their decision making, such as shown in the “Business Model Canvas” figure. The advent of agile and lean startup management practices provides a set of methods to treat innovation as management building on this canvas framework. What is captured on the canvas is the innovator’s vision as a set of assumptions to be tested.

As is noted in the “Business Model vs Lean Start-Up Canvas Elements” figure there is a slight distinction in the canvas used for business development projects within a Corporation versus a true startup. This is because in the former relationships already exist between partners and customers. Clarity about the basis of these relationships is important for project teams to understand when they take on innovation projects. In contrast, startups are more focused on generalized problems and solutions, and need to have much better clarity around why their product or service will offer an unfair advantage. This is because startups are entering the market without a brand upon which consumers can judge them. They need a truly unfair advantage in their product or service so consumers will take the risk to do business with an unknown entity.

The the inventor’s vision is tested with customers using experiments. This is done with the “Spiral or ‘Create-Test-Learn’ Development Process” as shown in the figure. By putting together a prototype and going out and learning from real customers whether or not the new product will help them do a job they need done, allows a team to either move onto scale up if it gets it right, or iterate again with another variation to test. As a project iterates toward success, the role of management is to track how well the teams are doing at aligning the innovator’s vision with a profitable business model.

Thus innovators have to solve for both technical and market risk. Within Stage and Gate R&D labs, companies are traditionally focused on technical risk. However market risk questions are just as important. Eric Ries makes a distinction between value hypothesis and growth hypothesis. In the former inventors are testing whether the products are genuine consumer needs. In contrast in the growth hypothesis the focus on how customers will find and buy the product, and also how the product will grow market share profits. Resolving these two hypotheses is key to successful innovation. The “Spiral Development Steps” figure shows the need to create prototype products that will help validate or improve the assumptions by getting out of the building.

Another attribute that is much better defined in spiral versus waterfall models is the need to identify and prioritize risky assumptions throughout the development process. In the “Identifying Risky Assumptions” figure each of the elements in the business model canvas are categorized as assumptions. Some of these are well supported by known facts, either in the technology or the marketplace. However there are also ideas that are merely assumptions. They are those that have no knowledge or evidence of their correctness. Using the business model canvas, the distinction between assumptions and knowledge should be identified. Typically this is done by marking each of the sticky notes with untested assumptions with a red sticker or “X”. Further within the identified assumptions will be ideas that are critical for the success of the business model. Other assumptions may not be as critical for success. Assumptions that are critical to success should be clearly identified on the canvas using blue stickers or “Y”. Risky assumptions are those assumptions that have both “X” and “Y” associated with them. These are the ones that need to be tested first by the team. This prioritization on the basis of critical for success and uncertainty allows the spiral model to succeed or pivot much more rapidly than is done in the waterfall model.

The next element that is typically done better in the spiral versus waterfall model is that of setting minimum fail criteria ahead of time. Stage and gate models often rely on soft criteria from voting at the gate review to determine whether a project succeeds or fails. Spiral model rely on the decision to proceed or iterate based upon predetermined “Minimum Failure Criteria” as shown in the figure.

As the team moves towards testing assumptions, what it does is take that top 1 to 3 most risky assumptions in each part of the business model canvas, and tracks testing progress of each risky assumption by filling in the “Tested Assumptions Map” as shown in the figure. By laying out the work to be done, and the results obtained, on a single large-scale map, allows a team to see at the conclusion of the testing whether or not the project will move on or whether it needs to pivot. If pivot is the answer, the map also reveals the background needed for the next generation of ideation.

 Innovation Life-cycle
 As shown in the “Innovation Life-cycle” figure developed by Maurya, three tools are used to answer three sets of important questions: (1) The Problem and Solution Fit. Do we have a problem worth solving? Do customers have a real need for the product? Are we working on the solution that meets customer’s needs? Will customers play for the solution? (2) The Product Market Fit. Have we built something people want? Are we achieving traction in the market? Have we found the right channels to reach customers and deliver value? How well are we signing up customers and retaining them? Can we create and deliver the product with the right costs and margins? Are customers paying for the product? And is a revenue model sustainable? (3) Scale. How do we accelerate growth? Have we found the right growth engines? How fast are we growing beyond the early adopters of our product? How quickly are we adding and retaining new customers? How fast are we growing revenues? Have we reached breakeven or profitability?
Note that in the “Innovation Lifecycle” figure, various parts of the business model canvas are focused upon as the project moves through the three phases of the innovation lifecycle.
Looking at the business model canvas after brainstorming sessions or idea competitions, the issue becomes how to spend the money the team has to work on the best projects. To help make these decisions, projects can be compared by focusing on two main questions. (1) Is the project aligned with our company’s strategic goals and innovation thesis? (2) Does the business project help us meet our goals for achieving a balanced portfolio?

To prioritize the project, projects are segmented as shown in the “Project Selection Matrix” figure. To use this matrix, three activities are done. First, all the projects are put on sticky notes. Second, projects are placed vertically on the “Project Selection Matrix” figure using a pairwise comparison method. Third, without changing the vertical ranking, each project is moved horizontally via a pairwise comparison based upon how much the project helps balance the company’s portfolio. Note that to do this effectively, a good idea of the company’s business needs to fill future revenue and profit gaps are needed. Projects in the in the top right quadrant of the Matrix represent ideas that should be considered first for further development.

The “Comparison of Lean Project Life-cycle Attributes” figure makes the contrast between the Stage and Gate methods and Agile / Lean methods stark. The agile and lean methods focus on speed early on to develop both the technology and business model. They also utilize very different success metrics. Only after the project reaches the Executing stage do the Agile / Lean attributes resemble those of the Stage and Gate process.
Introduction of the agile or lean development model occurred primarily in the software industry. In this industry business models and technical developments are rapid because of the nature of the technology involved. It is more difficult for more traditional brick-and-mortar corporations to adopt such processes. As such modifications of the stage and gate model to include business model development and conduct iterative consumer testing with prototypes has been developed.


The integration occurred because a structured gating process for product innovation has clear benefits. It reduces the risk and costs of project failure and increases the chance of new products success. However, combining the principles and methods of Agile project management with the tried-and-proven Stage-Gate method for the development of new services and physical products has merit. Evidence shows that this new hybrid approach speeds up the innovation process, makes it more flexible and iterative, and ensures a measurable output early in the process. Choosing which development models to use as templates can be done by referring to the industry segment R&D Games Models described earlier as well as looking at the “Elements of Agile and Stage-Gate Methods” figure .
Horizon 3: Fuzzy Front End and Radical Innovation Project Management Practices
Clay Christiansen in his book The Innovator’s Dilemma, showed clearly why great companies can fail. He points out that is companies go through their normal technology maturity S-curve there reaches a point in which a new disruptive technological change provides greater value to the end-user or customer. He further points out that the responsibility for utilizing disruptive technologies falls to those organizations whose customers need them.
R&D managers who confront disruptive technology change must be leaders, not followers, and commercializing disruptive technologies. Doing so requires implanting the projects that are developed such technology inside commercial organizations that match and size the markets they are to address. These assertions are based on two key findings of his studies. First it leadership is more crucial in coping with disruptive technologies that was sustaining one’s and second the small emerging markets cannot solve the near term growth and profit requirements of large companies. Said another way, small skunk work startup entities are much more likely to succeed in commercializing disruptive technologies than larger organizations are.
In work that Gina O’Connor from the University of North Carolina reported to the Industrial Research Institute she and her team found that an organization’s leadership needed to possess three competencies for radical / breakthrough innovation to occur. The three competencies they require are in the areas of discovery, incubation, and acceleration of radical innovation projects, see the “Radical Innovation Capability” figure.


Thus a full radical innovation capability consists of these three distinct capabilities, which not only need to be effectively managed, but the transitions and interfaces between these three capabilities need to be well connected into a seamless process. The business leadership must also truly understand that radical innovation is not a linear process. They must additionally understand that radical innovation projects need different management systems from those of incremental and next-generation research. As is pointed out in the book Radical Innovation by Richard Leifer et al, it is extremely difficult for large organizations to conduct radical innovations that are commercially successful. That said, the “Level of Radical Innovation Maturity and Associated Management Mechanisms” figure shows the level of radical innovation maturity and associated management mechanisms necessary for success.
In the discovery phase of radical innovation business leaders need to create and articulate the opportunities in front of them. They need to support exploration of such opportunities in both the market and technical arenas. This means supporting basic marketing and technical research studies using both internal and external company resources and personnel.
In the incubation phase of radical innovation is necessary in order to a ball opportunities in the business propositions. A business proposition is a working hypothesis about what the technology platform could enable in the market, but the market space will ultimately look like, and what the business model will be. The management team must support evolving the opportunity into a true business proposition and plan. This means conducting market experimentation with focus groups and other methods, and technical proof of principle using internal and external capabilities. The key is to learn rapidly what the market will and won’t want in the product and on the technical side will it be possible to create a solution ahead of competition.
A last competency a management team needs to possess is in the area of acceleration of projects. Acceleration is defined is ramping up of the fledging business two point work and stand on its own relative to other business platforms in the ultimate receiving business unit. The skills needed are those required for managing a high-growth business. The real challenge Gina found was that a management team needs to keep projects alive. This is often the time where the project falls into the Valley of Death is Hewlett-Packard describes it. When the chips are down and nothing seems to be working the management team needs to continue to drive and apply resources to move the project forward. As the project goes commercial the challenge is to continue to apply the resources necessary to accelerate commercialization and take full advantage of the first mover’s position in the market.
Most firms excel at one or two of these three competencies. Few are good all three. The research showed that it’s really important before embarking on a radical innovation strategy to make sure that company capabilities are in fact in place. If they are not, projects stall and fail. If the capabilities are needed they should be built before projects are undertaken.

A more comprehensive set of guidelines was developed by Mel Perel at Battelle who studied multiple organizations which had successfully commercialized Breakthrough products. The “Elements for Breakthrough Projects” figure shows these. The most important success factor was that successful corporate breakthrough efforts were strongly supported by the CEO and executive management. The projects themselves reported to a high-level executive and employed a dedicated, full-time team, led by a champion, and supported by a clear charter. This strong support was clear and unwavering. Efforts that did not have such high level clear, unwavering, and strong support almost universally resulted in failure. This point cannot be made emphatically enough.
With respect to the variation amongst projects, insight can be gained as to how radical innovation projects can be done in different business environments by looking at the columns in the chart. Using the R&D Games section of this website explains those differences.

For companies interested in managing the front end of innovation internally, a large group of companies in the early 2000s working on breaking apart the elements of that process, and came up with a model for doing so. The key insight that this group of Industrial Research Institute members came to was that the process was actually a random walk amongst five categories of work. This is shown in the “Fuzzy Front End of Innovation Model” figure.
In this model the engine is shown at the center. This connotes the corporate leadership behaviors, the type of culture that the leadership has created, and the clarity by which their business strategy is articulated. This insightful and supportive structure has to be present or the fuzzy front end of innovation will commercialize nothing. For those individuals involved in creating new concepts they make a random walk between idea genesis, identifying opportunities, analyzing opportunities, concept enrichment, idea selection, and concept definition. It cannot be emphasized enough that this is not a linear or straightforward process. Successful innovators walk around the elements of this model seemingly at random, spending time in each of these five areas.
For company to develop a strong front end of innovation it needs individuals that are comfortable and practiced in this process. Hence comes the argument that it is more productive for a company screen for such people and such ideas from outside the Corporation versus finding these individuals and ideas from within. This was articulated clearly in Clay Christiansen’s the Innovators Dilemma. Large companies typically do not select personnel based on their capability for front end of innovation. They are usually selected for their ability to carry projects successfully down a stage-gate type process.
The influencing factors around the exterior of the model are meant to point out the large variety of resources that are needed for innovators to succeed. They have to have deep insight in to customers, competition, substitute technology, suppliers, societies needs, constraints and regulations. Without this background knowledge, oftentimes innovations are unique but not commercially viable. It is an interplay of all these factors that finally winds-up with a concept that is defined well enough and robust enough to enter into the new business development or stage gate process. Supporting tools for this process are found in the competitive intelligence and intellectual property chapters of this book.
One of the best and most concise studies put together to describe clearly what’s needed to do breakthrough research was done by Karen Zien and Dr. Perry. Although they did this work for the Xerox Corporation in 1994 it still one of the best resources to use two decades later. In their work on what nurtures or restrains invention and innovation in a company, they did over 100 on-site interviews across three regions, US Japan and Europe, with 16 companies and multiple divisions and regional subsidiaries. The interviewees were cross functional, including inventors, technical, marketing, business management specialist, heads of companies, divisions, research laboratories and subsidiaries.

They focused on three areas. These were the external environment, the internal environment, and individuals. The external environment studied included customers, markets, competition, standards, and partners. The internal environment studied had to elements culture and conduits. Under culture they studied values, history, reward and risk, and learning. Under conduits they studied structure and processes, pathways, decision-making, and communication.
The third focus area, individuals, was broken down into heroes and heroines, characteristics, and circumstances. Visual picture of these three areas in their relationship is shown in the “Focus Areas Important for Discontinuous Innovation” figure.
The key learnings from the study were the following:
1. The fuzzy front-end is inseparable from implementation.
2. Truly innovative companies have customer intimacy.
3. It is really difficult to build a shared conceptual model portrays nonlinear aspects.
4. Individual creative spirit is at the core; motivation is personal.
5. Creative cultures are regenerated by the stories told.
6. An invention and innovation culture is a system that must be called for and energized from the top.
7. Continuity in roles such as project champions, sponsors, project leaders, internal customers, external consultants, and teams is critical. Continuity must survive reorganizations, changes in membership, and departures from the company.
8. Always beginning at the beginning of each project with some individuals.
9. Senior executives must create pathways for ideas that have no home in the current business structure.
10. Executives must stay connected and form new connections.
11. Continuously understand the system and reformulate change strategies continuously
12. Storytelling, anecdotal data, is a most important form of transferring learning.
13. Working with qualitative data is labor-intensive.
14. Videos bring stories to life.
15. The work of getting beyond one’s own organizational paradigm never stops.
16. Innovative companies are fascinated by innovative methodologies.
17. Qualitative data is not well understood and business, thus the need for storytelling and graphic display of information.
18. Maintain a coherent team in spite of comings and goings.
19. Teams have to survive more than one crisis of commitment.
20. Barriers continually lead team members to continuously invent new structures for participation.
21. Beginning skills and competencies of team members become shared among all members.
22. Getting to work on the project was a reason to come to work.
23. Learning to sit with uncertainty and discomfort and commitment to hold the course is critical.
24. Experiment, seize opportunities, be driven by vision.
25. Struggle to hold onto the commitment that changes possible in the face of history, current events, and the natural flow of things.
26. When the project creates truly new openings be prepared for strong reactions.
27. The whole process presents unpredictable, unforeseen challenges and opportunities.
Because of the difficulties in doing radical innovation, it was said by Frederick Buggie in his RTM article, Set the fuzzy Front-end in Concrete, that any fuzzy new product concept is a lamb led to slaughter by the stage gate review committee. Instead if a company is serious about doing fuzzy front end or radical innovation work, a company’s top executive team, those who know most about the organization’s capabilities and have the authority to set objectives and make go/no go decisions, must sit down to draft, then refine and confirm the new initiative. They must cover the financial goals, dates, company’s unique technologies it should be leveraged, production processes that can be utilized, the kind of market the company is comfortable with serving, and any deep-seated predilections or prejudices. Finally an acceptable means of implementation must be decided upon. This includes producing the radical new product inside the company, outsourcing it, partnering, or some combination. More often than not the company is best to move an internal team outside the company, or partner with a venture firm or others to form a joint venture outside the company’s walls. If the venture’s successful, a company may take the option to bring it back inside the company once it is standing on its own two feet. Connecting radical innovation in this way is now common practice among the leading companies in Silicon Valley in the second decade of the 21st century.

In closing this section on radical innovation the topic of technology readiness must also be covered. Technology readiness addresses the fact that for any new product innovation go into development without a full assessment of their technological readiness, the likely result is wasted time, and dissatisfied internal and external stakeholders. Although the concept of technology readiness can be applied to any Horizon One, Two Or Three project, it is often most useful when applied to Horizon Three or Breakthrough projects. This is because in strategic planning many companies can identify product functions that they want to incorporate into new products and services, but for which no technology to do so is known. In fact, typically a quick assessment of the patent and technical literature often shows that there is been no work yet done in the area, an IP Desert. Thus funding breakthrough technology projects makes sense to explore if it will be possible for science and engineering personnel to fill this needed gap before other resources are committed to a business development project. This work is often done where it is clear that the market trend is strong enough to justify technical expenditure without concurrent business development. In such a case the “Technology Readiness Assessment Matrix” figure is used to track progress of science and engineering team in developing a new technology. The degree of rigor required for technology readiness can depend upon the situation. A company may make a strategic decision to accept increased uncertainty associated with an unready technology if, for instance, the technology is radically new and promises a large competitive advantage. In this case the vertical line in the “Technology Readiness Assessment Matrix” figure indicates to the development team the minimum requirements for their seed project to meet. In this example the team has yet to successfully complete two of the requirements before management will consider the technology close enough to commercialization to be incorporated into a business development project. When using this methodology, it is best practice to incorporate an external peer review by people knowledgeable in the relevant markets and the science governing the technology. This is done because the exact level of technology readiness is uncertain until a true business development team is put together to utilize it. Government organizations involved in engineering disciplines such as NASA and the United States military use technology readiness Levels of 1 to 6 to characterize readiness as shown in the columns of the table. The assessment from the table becomes the input criteria for project selection processes.
Global Innovation Project Practices
Gaining the benefits from global technology networks is critical today for all organizations but especially those of large multinational corporations. The process started in earnest in the late 1990s and early 2000’s. At that time efforts were rudimentary in international R&D organizations were put in place mostly to customize a corporations major product lines to the unique needs of local marketplaces and customs. From a large Corporation standpoint Joe Miller and Perry Norling of DuPont pointed out the most important drivers for globalization from their standpoint were (1) possible limitations in the supply and quality of technical talent in our own country and in certain technical fields,(2) the extent of the need to supply new technology to our manufacturing facilities abroad, (3) the extent to which customer needs greatly differed in the home versus abroad markets, and (4) the extent to which sciences and technologies being developed abroad are not accessible operating from afar. Typical key lessons learned at this time were:
1. Huge tasks require effective use in coordination of external resources..
2. Using worldwide resources saves time, company human resources, dollars, lab space and equipment.
3. It is not uncommon to obtain a 5 to 10x multiplier on each company R&D dollar. Others have the talent, available equipment, and are ready to work, so they can do more efficient and effective work at a lower cost.
4. As leverage goes up, control of proprietary information goes down. This has to be managed in risks recognized.
5. Partnering with worldwide customers who have complementary expertise can be most rewarding.
6. During international networking one often gains access to surprising technological expertise.
7. Leveraging resources can foster industrial teamwork to solve worldwide problems.
8. Significant excitement can be generated in universities and government laboratories work is being done a truly significant problem with international impact.
The rapid pace of technological development and the globalization of almost all industries are major forces compelling all companies to devise new ways to innovate better, faster and more efficiently. In response, most companies have developed a global R&D network that significantly expands the research and development capabilities. The network often encompasses internal R&D labs in tier 1 and BRIC countries, as well as collaborative labs focused on strategic areas of research at leading universities throughout the world, private laboratories co-owned with noncompeting companies, joint ventures with alliance partners, co-developed work with suppliers and strategic partners, participation in industry-government cooperative programs, and involvement in precompetitive research consortium with other companies are all viable means by which corporations are leveraging their R&D efforts. Having offices in various locations around the globe, which service listening posts to identify local centers of expertise and collaboration opportunities, have enabled access to key technology resources and scientific expertise centered in various regions of the world. These evolving drivers argue for use of international R&D resources.
A common problem that globalized R&D centers can address has to do primarily with regulatory affairs, standards bodies, and customer preferences. The significant cultural and societal differences clearly manifest themselves in the diversity of country regulatory schemes. A global R&D organization can organize work processes to create efficiencies to produce products that can be marketed around the world while accommodating these diverse regulatory requirements. This has been especially true in the food and automotive industries. As such product development teams include members from around the world that represent these perspectives, assuring that relevant design, specifications, and testing is done to ensure rapid global product introductions.
The initial hurdle to utilizing cross-regional teams had to do with communications and information technology limitations. Now the second decade of the 21st century these limitations have for all intents and purposes been lifted. Also as the education levels around the world rise, the opportunity to select project team members from the best of the best as possible. For companies operating in the value portion of the performance cost matrix the opportunity to conduct low-cost R&D by doing the work in low-cost, high capability countries such as India is presented leading companies in many industries unique opportunity.
Continuing hurdle to utilizing cross regional teams has to do with intellectual property rights. Inventor rules, inventor compensation, and definition of protectable subject matter vary across regions. These issues will be addressed in the intellectual property chapter of this book.
Organizational Structures for Managing Technology
Innovation Board
Some organizations empower the Chief Technology Officer with managing all aspects of the innovation process. Alternatively some companies create a central fund that invests in innovation. The budget for an Innovation Board is allocated and managed separately from the main businesses. This allows investment in innovation be managed with different expectations in terms of the ROI. Access to the fund can be open to all employees who have to go through some application processor or win an innovation competition. The investment decisions of the board can be informed by an innovation thesis and the company portfolio goals. Funding can also be released incrementally at certain stages and Gates. In this regard the Innovation Board can deliver on the innovation strategy and be involved with auditing innovation management. In this model the Innovation Board is often led by the Chief Innovation Officer. The Chief Innovation Officer reports to the CEO. The business development functions supporting incremental and mild next-generation work report to the Chief Technology Officer, who then reports to the COO in this model. See the section on Fourth Generation R&D.
R&D lab
For companies that work on products with high levels of technical risk, and Arnie that can be a great investment to make. What are the key innovation questions for any product service is can be done? Answering this question is particularly important for industries such as healthcare, energy and transportation.
Work of the R&D lab is directed by an innovation thesis and/or technology strategy. The main limitation of a pure R&D lab is that it often fails to answer the second key question of innovation. This is “should it be done?” This means that business model validation work is often lacking. The option some companies choose to use is to move promising technologies from a R&D lab into an Innovation Lab. Alternatively, R&D organizations include business stakeholders in their product development teams to make sure the “should be done?” question is answered. Which works best depends upon a company’s culture.
Innovation Lab
This is like an in-house startup accelerator. It combines elements of an Institute, competitions and an Innovation Board. Labs are often set up as separate institutions that are tasked with investing in ideas and managing innovation teams. The budget for the lab is allocated and managed separately from the main business. Labs are open to all employees who can apply to join on a cohort by cohort basis. Competition for places is managed using application templates and/or an idea pitching process.
There are two options for managing an Innovation Lab. The company can manage the lab themselves internally with hired staff or they can partner with an external accelerator to do so. The external partners bring their knowledge expertise and networks to help the company with innovation. The disadvantage is they often don’t understand the company’s culture. Teams that are chosen to work on new projects spend time working in the lab on their ideas. For innovation labs based on a venture capital model, the investment and acceleration processes are usually separated into two parts. The first seed stage is comprised of a period during which teams get an initial investment to test their ideas and validate their business models. The second growth stage occurs when teams get further investment to take their ideas to scale.
An innovation lab can be used to support innovation strategy and innovation management. Investments can be based on clear innovation theses and funding can be done incrementally for each project with the stages used to track progress. Innovation labs also deliver well on innovation management practices, as teams can be trained and supported by innovation trainers. Since the lab is often a physical location it can function like an Institute in terms of community.
Major risk innovation lab face is isolation from the main business. The innovation lab can have its own great innovation culture, but have very little impact on the innovation practices within the parent company. This is more severe than for the R&D lab because innovation labs by definition host business and technical personnel. R&D labs in contrast are designed to be inclusive of the main business marketing and product development personnel. To overcome this problem the innovation lab should be managed by making sure there is strategic alignment between the parent company and the ideas that are being developed in the lab. The Chief Innovation Officer is often the person who does the hard work of managing relationships between the lab and the parent company.
The R&D Games Model is an ideal mechanism to determine which industries can benefit most from R&D Labs versus Innovation Labs.
Valuing Technical Projects: DCF, Options and Other Methods
Valuing technical projects is key to accurate portfolio management, stage gate decisions and resource allocation issues. The methods vary according to whether a project falls into Category 1 Incremental, Category 2 Next-Generation, or Category 3 Radical and Breakthrough Innovation.
For Horizon 1 Incremental projects discounted cash flow (DCF) is a quick and easy way to calculate the value of a project. This is because for incremental projects the market is well understood and projected sales and costs to develop a product can be estimated with high accuracy. Timing of the costs and timing of the sales volumes can also reliably be estimated. For such projects there is little need to add more complexity to the evaluation process.
For Horizon 2 Next-Generation projects discounted cash flow does not work well as a method for evaluating projects. This is because of the increased uncertainty of both the costs that will be involved and the resulting revenue streams that are anticipated. Additionally the timing of both the cost and revenue streams is uncertain. For the complexity is that more than one technical approach is likely to be an option for next-generation projects so the probabilities of using one approach or the other has to be taken into consideration. Early work done by the strategic decisions group took into account these factors by utilizing decision trees to mimic the technical choices and options that a project might utilize as well as the sales revenues and pricing structures that might occur after launch. Using decision trees with conditional probabilities allowed uncertain events and a project to be summed to give an overall estimate of a project’s ROI or total value to the Corporation. Because alternative strategies are possible for each project choosing the best one requires finding the “efficient frontier”. That is a strategy that yields the best value for a given investment level. The methods SDG uses are outlined in the book Decision Quality by Carl Spetzler et al.
This form of evaluating R&D projects now takes the form of risk analysis. Risk analysis applies analytical tools to identify, describe, quantify, and explain uncertainty and its consequences for R&D projects. When choosing between competing alternatives decision trees are used. When just quantifying the risk or the uncertainty the tool of choice is Monte Carlo simulations.

A decision tree is a visual model consisting of nodes and branches such as shown in the “An Example of a Simple Decision Tree” figure. Usually grows from left to right beginning with the root decision to start a project and the branches represent two or more competing options available to the project leaders. At the end of the branches there is either a value mode or in uncertainty mode representing the possible outcomes along with their respective probabilities. For next-generation R&D projects these models can become quite complex. The advantage however is that software is now been developed to make this process easy to implement.
The caution to this approach is one of “garbage in, then garbage out”. It is difficult for project teams and project leaders to expend an appropriate level of energy assigning probabilities and values to the decision trees. Sometimes the estimates are thoughtless and error-prone. Other times project teams spend more time developing the models than they could’ve spent in doing the actual experiments themselves. One approach to resolving this dilemma is to specify during the stage gate process for any stage, the amount of time the project team should spend on the model. The project team should then share at the gate review which of the nodes are the most uncertain. Using a sensitivity analysis the project team can then decide which of the uncertainties they have are worthy of further work in assigning more robust values.
For companies with a large number of projects going down the stage gate process David Walwyn and his colleagues argued in How To Manage Risk Better that a Jarrow and Turnbull model for credit risky bond pricing can be of applied to R&D projects. Their method works out well because stage and gate processes involve evaluation that takes place set points. There typically a fixed number of hurdles and for large organization they average out to be equally spaced in time. The projects’ progress can then be considered as a discrete time process. The project reviews are considered as “paid” or “default” in a bond model. For companies with good historic data this offers a comparative approach to projects useful for R&D management. It’s weakness is that it lacks the rigor that some CFOs, general managers, and executive teams desire.
Moving now to the evaluation of Horizon 3 Radical and Breakthrough projects, the methods become more qualitative and less quantitative. Attempts to keep the valuation methods quantitative involve the use of Real Options. The reason Real Options are used is because they have the ability to quantify: (1) a right but not an obligation to use the technology, (2) account for flexibility over the way in which the product is developed and marketed, (3) allow for choosing when and how often during the development process the project might continue, (4) the uncertain cost of expenditures is a project continues, and the (5) uncertain value of the project as it is commercialized.
Real Options can capture the value of managerial operating flexibility. Real Options can occur naturally, maybe built-in or acquired a cost. Examples where a firm may acquire Real Options comes from intellectual property rights (such as patents licenses leases etc.), ownership of natural resources (such as real estate and oil fields). technological know-how, reputation, brand name, strategic alliances, market position, organizational capabilities, infrastructure, employees, etc. Some common behaviors that are accounted for by Real Options are the ability to defer, stage or abandon, expansion or growth, shutdown or restart, switching, multiple options, interacting options. With such inputs Real Options can answer such questions as: (1) how valuable is a right to invest at a future time if the circumstances are right, (2) how valuable is it to have resources deployed elsewhere until circumstances to develop the current project are appropriate, (3) to defer development until prices sufficiently high, or (4) move to a new business model. Another advantage of Real Options is that it captures value not only from direct cash flows from the product developed but also from additional cross-selling opportunities that may open up after the initial product is launched. This includes the ability to expand into new products, reach new customers, and find new partners. Real Options also takes into account the asymmetry in probability distributions for any of the events or choices that a company might make. As such, the evolution of real option valuation models has increased in sophistication from static or mechanistic models, to controllable cash flow models, to dynamic game theoretic or industry equilibrium models.
Because of the complexity of the Real Options process, the cost of using it are extremely high and it suffers just as all valuation methodologies do from “garbage in, garbage out”. As such, although in theory Real Options provides R&D management with a very solid value of R&D programs, in practice this method is rarely used. More common is to use a sensitivity analysis first on the important variables affecting a project’s cost and value, then utilize a decision tree to assess likely outcomes.
Sources, References and Selected Bibliographic Information
1. Structuring and managing R&D work processes, Parry Norling, Chemtech, October 1997, p.12
2. PDMA New Product Development Survey, paper presented at PDMA Conference, A.L. Page, Chicago, November 13, 1991
3. Benchmarking Best NPD Practices, Robert G. Cooper et al, Research Technology Management, Jan-Feb 2004, p. 31
4. Example Company Audit, Price Waterhouse Report and Recommendations, September 1997
5. Post-Project Reviews in R&D, Max von Zedtwitz, Research Technology Management, Sept-Oct 2003, p. 43
6. Evolution of design for six Sigma in an organization, Dave Anon, presented at Six Sigma And Design For Six Sigma in R&D workshop at Corning Incorporated, Corning, New York, March 18, 2003.
7. Six Sigma 101, Dave Anon, presented at Six Sigma And Design For Six Sigma in R&D workshop at Corning Incorporated, Corning, New York, March 18, 2003.
8. Six Sigma and stage gate combining the approaches, Raymond Weinert et al, OMNOVA Solutions, presented at Six Sigma And Design For Six Sigma in R&D workshop at Corning Incorporated, Corning, New York, March 18, 2003.
9. Gina O’Connell, Radical Innovation Capability, Research Technology Management, January-February 2005.
10. Set the fuzzy front-end in concrete, Frederick D. Buggie, Research Technology Management, July-August 2002, p. 11.
11. How discontinuous innovation really happens, Perry Norling and Robert Statz, Research Technology Management, May-June 1998
12. Learning to innovate; innovating to learn, Karen Zien and Barbara Perry, Polaroid invention and innovation research project presentation
13. Fuzzy front end survey of optimum practices, Peter Koen, presentation given at Industrial Research Institute meeting, February 2003
14. New products what separates winners from losers, Robert Cooper et al, Journal of project innovation management, 4(3), 1987, p. 169-184
15. Managing product definition and high technology industries a pilot study, Glenn Bacon et al, California Management Review, Spring 1994, p. 32
16. What separates Japanese new product winners from losers, Michael Song et al, Journal of product innovation management, 13, 1996, p. 422
17. Managing Technology, The Strategic View, Lowell W. Steele, McGraw Hill, New York, New York, 1989.
18. How to Successfully Keep R&D projects on Track, Robert Szakonyi et al, Lomond, Mt. Airy, Maryland, 1988.
19. The One-Page Project Manager, Clark Campbell, John Wiley & Sons, 2007.
20. Winning at New Products, Robert Cooper, 3rd edition, 2001.
21. Technology Management: Case Studies in Innovation, edited by Robert Szakonyi, Auerbach Publications, 1992.
22. The Innovator’s Dilemma, Clay Christiansen, Harvard Business School Press, 1997.
23. Radical Innovation, Richard Leifer et al., Harvard Business School Press, 2000.
24. Providing Clarity and a Common Language to The Fuzzy Front-End, Peter Koen et al, Research Technology Management, April 2001, p. 46.
25. Product Development, Faster, On-Time, Morgan Swink, Research Technology Management, August 2002, page 50.
26. Managing Global Innovation, Roman Boutellier et al, chapter on Gaining The Benefits Of Global Networks, From Science-Based Marketplace. Joseph Miller and Perry Norling, Springer, 1999, p. 223.
27. Best Of Global, Best Of Local: Challenges And Opportunities For Krafts Food Global Technology Quality, Jean Spence, presented at the Industrial Research Institute Fall Meeting, October 2004.
28. Globalization R&D: Strategies and Implications, Boeing International Relations, Thomas Pickering, presented at the Industrial Research Institute Fall Meeting, October 2004.
29. Key R&D Strategies and the Toyota Way, David Baxter, presented at the Industrial Research Institute Fall Meeting, October 2004.
30. Globalization and Low-Cost R&D: Strategic Implications, Organizational Models and Business Practices, Anil Khurana, presented at the Industrial Research Institute Fall Meeting, October 2004.
31. Decision Quality: Value Creation from Better Business Decisions, Carl Spetzler et al, Wiley, 2016
32. Medical Decision Support, Professor Lucila Ohno-Machado and Professor Staal Vinterbo, Harvard-MIT Division of Health Sciences and Technology , 2005, https://ocw.mit.edu/courses/health-sciences-and-technology/hst-951j-medical-decision-support-fall-2005/lecture-notes/hst951_2.pdf
33. How to Manage Risk Better, David Walwyn, Research Technology Management, October 2002, p. 37.
34. Real Options Valuation: Overview of Basic Concepts and Strategy, Lenos Trigeorgis, Real Options Group, presented at Real Options Valuation in the Connected Economy, conference on valuation and strategic portfolio management, UCLA, Los Angeles, July 2001.
35. “The corporate start-up” by Tendayi Viki, Dan Tome, and Esther Gons, Vakmedianet, 2017.
36. “The role of the business model in capturing value from Innovation”, by Chesbrough and Rosenbloon, Industrial and Corporate Change, 11(3).
37. “Business model generation: a handbook for visionaries, game changers, and challengers”, by Ostervalder and Pigneur, Wiley, 2010.
38. “Why Big companies can’t innovate”, by Wessel, Harvard Business Review, 2012.
39. “Lean startup in the enterprise – prepare for a bumpy road”, Enterprise World, 2016.
40. “To succeed in the long term, focus on the middle term”, by Moore, Harvard Business Review, 2006.
41. “The startup owner’s manual: the step by step guide for building a great company”, by Blank and Dorf, 2012.
42. “The lean startup: how today’s entrepreneurs use continuous innovation to create radically successful businesses” by Ries, Crown Books, 2011
43. “Running Lean: Iterate from plan A to a plan that works”, by Maurya, 2012.
44. “The lean product lifecycle: a playbook for developing innovative and profitable new products”, by Viki, Strong, and Kresojevic, Pearson, 2017
45. “Crossing the Chasm”, by Moore, Harper Business, 1999
46. “Integrating Agile with Stage-Gate – How New Agile-Scrum Methods Lead to Faster and Better Innovation”, by Tomas Vedsmand, Søren Kielgast and Robert G. Cooper, Innovation Management, 2016, http://www.innovationmanagement.se/2016/08/09/integrating-agile-with-stage-gate/
47. “From Waterfall to Iterative Development”, by Phillippe Kruchten, White Paper from The Rational Edge, 2001
48. “Best practices in breakthrough product development and funding”, by Mel Perel, White Paper Battelle Memorial Institute, 2001.
49. “Technology Readiness”, by Don Clausing and Maurice Holmes, Research Technology Management, August 2010.
50. “Business Experiments Disciplined Learning”, by James A. Euchner & Abhijit Ganguly, IRI Brown Bag presentation, May 2018.
51. “Getting Customer Needs Right from the Start: how to use agile and design thinking for better results, faster.”. by John Carter in Jeanne Bradford, Management Roundtable Presentation, October 2017.
52. “Balanced Innovation”, private IRI Emeriti conversations Geoff Nicholson of 3M and Albert Johnson of Corning, April 2007.
53. “Innovation and Inventions”, by Moti Margalit, White PaperTRIZ presentation, Dec. 2018.
54. “Innovation Management Masterclass”, by Tendayi Viki, Presentation from Benneli Jacolbs Company, Dec. 2017.
55. “What Program Management Tools Do You Use?”, by IRI Community Forum, IRIweb, April 2018.
56. “Think Breakthrough”, by Jim O’Connor and Doug Berger, Interview conducted by Innovate, Dec. 2006.
57. “Enabling your Enterprise with Text Analytics”, by John Anthony and Scott Chalfant, The Hartford, June 2006.
58. “Agile Is Not Enough”, by Will Poindexter and Steve Berez, March 2019.
59. “How do you Prioritize NPD”, by IRI Community Forum, IRIweb, Dec. 2017
60. “How to Monetize Your Data”, by Barbara Wixom and Jeanne Ross, MIT Sloan Management Review, 2017.
61. “Designing and Developing Analytics-Based Data Products”, by Thomas Davenport and Stephan Kudyba, MIT Sloan Management Review, 2016.
62. “Developing New Products in Emerging Markets”, by Srivardhini Jha, Ishwardutt Parulkar, Rishikesha Krishnan, and Charles Dhanaraj, MIT Sloan Management Review, 2016.
You must be logged in to post a comment.