
Integrated Business, Technical, IP and HR Processes
- Integrated Business and Technology Processes (4th Generation)
- Integrated Business and IP Processes
- Integrating Business Importance & Urgency with HR Levels of Thought Capabilities
- Intellectual Capital (Business, Technical, Human) Valuation Processes
- Sources, References and Selected Bibliographic Information
——————————————————————————
4th Generation Integrated Business and Technology Processes

Since 1900, there have been “Four Generations Of Innovation Management” that have been accepted as best practice as shown in the figure. However, core limitations exist in the first, second and third generations of innovation management that form barriers to radical innovation and block needed improvements in the disciplines of management including investment strategy, strategic planning, executive business management, R&D, marketing, human resource management, organizational development, collaborative partnerships, and financial accounting and analysis.
In his seminal work on R&D management, Bill Miller uncovered the requirement that radical innovation has to become a new industry dominant design if it was to achieve commercial success. His 4G process effectively enables such radical innovation.
4th Generation Principles and Practices

The fourth generation (4G) of R&D and innovation management has twelve new fundamental principles and practices, summarized in the “Twelve Principles of 4G” figure. Practicing these principles is essential in order to unleash radical innovation in an organization. Key in these processes is the tight integration between business models and technology developments. Such integrated action is needed in order to meet the third principle of targeting a new Dominant Design. The dominant design usually incorporates both the preferred business model and technology preferences of customers.
The New Market Knowledge Channel in 4th Generation Innovation

In order to understand what the true preferences of consumers are, today’s companies must take advantage of “The New Knowledge Channel in 4G” as shown in the figure. The Channels in restructured markets are part of a new 4G dominant design based on new supplier capabilities, new supplier business models, and new industry structures such as supply chains and distribution channels. The new 4G dominant design enables multiple markets for the Internet of Things (IOT). Big Data and analytics are at the core of the new supplier capabilities that operate the Knowledge Channel. With embedded analytics in smart networked products, the Knowledge Channel gives suppliers a new 4G marketing capability to better understand how customers actually use products and services. Supplier business models are also combining manufacturing with networked services based on the Knowledge Channel.
Solving core problems for customers requires mutually dependent learning between customers and suppliers during the R&D process to reveal latent needs and test prototype solutions. The Knowledge Channel enables value creation during R&D, and after operational deployment of products and services via an Innovation Extension Center that facilitates lifetime learning. It is a pair of processes that operate to enable suppliers to iteratively guess and then discover and confirm unmet latent customer needs by developing prototype solutions that customers iteratively test. This reveals their needs including the detailed value attributes, and uncovers the value of new prototype solutions through customer experiences.
Phases of Innovation in 4th Generation Innovation

It is a pair of nested iterative nonlinear innovation processes that enable business organizations (including its capabilities, business model and industry structures, supplemented with its suppliers as partners) to create a much higher level of value from radical innovation. The pair of iterative nonlinear nested processes replace the linear sequential ‘technology push’ model and stage gate process of innovation practiced in 1G, 2G and 3G that is only typically effective for incremental innovation within a market and an industry governed by an existing dominant design. The pair of 4G iterative processes enables acceleration of value creation, higher productivity and higher quality in both radical innovation and incremental innovation. These processes are shown in “The Six Phases of Innovation” figure.
To effectively support radical innovation, the pair of 4G innovation processes is nested with an inner and outer loop. These combine iterations of scale in capability and architecture to provide the required learning and advance through the four phases in the front-end of innovation as shown in Six Phases of Innovation Figure. The 4G Phases of Innovation can also be applied to entrepreneurship in start-up businesses with the exception that most start-ups by themselves can’t create new 4G dominant designs. The Lean Start-up model described by Steve Blank is partially an application of 4G’s principles.
4th Generation Innovation Nested Innovation Processes

For radical innovation to be successful both the business model and the technology must be simultaneously created. The “Two Nested Innovation Processes” figure shows how this works at a high level. The outer loop is an innovation process with larger scope that develops new capabilities in a group of suppliers, revised business models and industry structures including value chain as parts of a new dominant design. Within this outer loop is a second iterative ‘spiral’ process that operates inside as an inner loop to facilitate collaborative learning between a group of suppliers, including their development and delivery partners and their customers, to focus on developing a new dominant design.
4th Generation Innovation Pathway Matrix

Relating this body of work back to the Strategic Planning Section III, one can see in the 4G Innovation Path Matrix Figure how one moves from “knowing what you know” and “incremental innovation”, upwards towards accessing “not knowing what you don’t know” and “radical innovation”. The insight and power of this 4G process is that it allows such mental leaps to be made with confidence. The numbered circles in the “4G Innovation Path Matrix” figure show the location of significant milestones of completed activity at transition points that enter each of the first four phases described in the Six Phases of Innovation in 4G Figure. These milestones are the rough equivalent of stage gate decision points in a 1G, 2G or 3G linear process with the exception that the pair of 4G iterative processes can return project activity to an earlier milestone whereas the milestones in the linear process are Go/Kill decision points. ‘Options’ financial accounting is applied at the 4G milestones.
4th Generation Spiral Process

The spiral process shown in the “Spiral Innovation Process in 4G” figure incorporates tests of many business assumptions including the attributes of value described by the Eighth Principle of 4G. The spiral process helps build a business model in the outer process loop shown in the Two Nested Innovation Processes Figure using methodology that is an extension of Rita McGrath’s discovery-driven planning. The development of a business model, validated with customers, enables movement into Phase 3 and into the top row of the right hand column of the MATRIX shown in the 4G Innovation Path Matrix Figure.
4th Generation Business Model

When it comes to developing a 4G business model, the template is shown in the “Eleven Component Parts of a Business Model in 4G” figure. The 4G business model is an extension to the model described by Alexander Osterwalder. The 4G additions are the 4G Knowledge Channel, 4G capabilities and architecture (as a dominant design), the 4G pipeline of capabilities in development, 4G open innovation, the 4G Six Stages of Innovation, and the 4G pair of nested innovation iterative process that includes a spiral iterative process. These additions convert the Osterwalder model which is 3G to a 4G model.
As described in Phase 2 in the Matrix, a prototype set of capabilities and an architecture to structure the capabilities as a candidate for a new dominant design are initially developed in Phase 2 by the primary lead supplier as ‘capability stacks’. In Step 2 of the spiral process applied in Phase 3, these capability ‘stacks’ are refined, developed, acquired and shared by a ‘galaxy’ of partners eventually in a 4G Innovation Hub to build all the parts of a dominant design that include business models and industry structures. A ‘galaxy’ of partners is needed to form the minimum viable group (MVG) of linked capability ‘stacks’ for suppliers of all the parts of a solution for customers. The MVG is an extension to the minimal viable product (MVP) described in lean entrepreneurship since MVG enables a much larger scale of value creation driven by formation of a new dominant design that would contain multiple products and services.
Step 3 of the spiral process in Phase 3 does validation of the new value propositions and the prototype of a dominant design with actual customer testing initially in 4G Application Labs and later in an Innovation Hub. The prototypes containing critical parts of the new proposed dominant design are developed and tested in Phases 2 and 3. Validation testing in Step 3 in Phase 3 also further discovers, defines and confirms stakeholder needs as the new capabilities for suppliers and customers to accomplish a required task, perform a job or achieve some set of objectives that have value described in Value Innovation.
In Step 4 of the spiral process in Phase 3, the tacit behavior that was observed with tools such as video ethnographic tools in Step 3 is used to form explicit knowledge in which gaps between desired stakeholder performance and a candidate dominant design are identified and analyzed. To fill the gaps, new or modified scenarios (similar to pivots in lean entrepreneurship) are created in Step 1 of the next iteration of the spiral process. The 4G pair of iterative processes continues until desired results are achieved or the project is terminated.
Integrating the business elements of human resources planning, the Ninth Principle guides human resource management (HR) inside an organization by recognizing that innovation leadership requires people as innovators to have “T-shaped” knowledge which has horizontal breath across many business disciplines such as finance, law, marketing, sales, information technology and engineering, but also vertical deep knowledge in at least one discipline and a good understanding of all twelve principles of 4G that guide innovation management. The career path for such qualified innovators leads to Chief Innovator Officer and CEO.
The Dyadic 4th Generation Organization

On the operations side of 4G innovation the Tenth Principle of 4G directs the creation and operation of two new types of innovation labs that supplement traditional R&D labs and market research activities such as focus groups and surveys that are jointly staffed by partner organizations. The new labs facilitate focused multidisciplinary problem solving and learning in a collaborative activity such as a multiyear project between a company and a selected university. In the first type of lab which is an Innovation Discovery Lab, new capability is targeted to be acquired with 4G open innovation and developed with intellectual property protection such as filing patent applications before customer testing occurs in the second type of lab, which is an Innovation Application Lab. 4G open innovation includes the inputs of licensed external technology acquisition and also corporate venturing to create start-ups as suppliers of new strategic capabilities. The Innovation Discovery Labs are typically located next to a university. The Application Labs are located in places which facilitate customer testing of prototypes and help prepare partners to create and operate an Innovation Hub. This creates a Dyadic Organization as shown in the “Dyadic 4G Organization” figure.
A new fourth generation (4G) of innovation management with twelve principles is required to overcome limitations (constraints in TRIZ terminology) in most disciplines of management and restore value creation to adequate levels and rates by effectively enabling radical innovation and improving incremental innovation. Unlike disruptive innovation, 4G innovation begins with the objective to discover and solve a core problem limiting economic growth in an industry with a solution based on radical innovation. Radical innovation in 4G creates value at a higher level based on a dominant design that has 3 parts – (1) a set of new capabilities needed by a group of customers delivered by (2) new capabilities and business models for suppliers that extend and restructure the (3) linked capabilities in the value chains that cross multiple markets and industries and that form structures such as supply chains and distribution channels.
The benefits of such fourth-generation processes that integrate across the business functions are great. The biggest challenge of course is for the senior leadership in a Corporation to undertake such a large-scale organizational change project.
Integrated Business and IP Processes
Companies typically have a system in place for new ideas. These include systems for identification, evaluation, and handling new products and service opportunities. They also typically have a somewhat aligned their R&D and IP portfolio integration with business strategy. And finally they often have a core business that has evolved its business strategy over time but those strategy changes have not been reflected in the R&D and IP portfolio’s selection. As a result, what is created is a broad array of patents and proprietary information, as well as numerous patents that are not well matched to the company’s business needs and direction.
As an example, creating IP was historically an important business process for Procter & Gamble. However, by the early 2000’s P&G held over 27,000 patents but only was using approximately 10% in their own projects, products and services. Because at that time there were rapidly increasing international patent maintenance costs, there was increased pressure to improve decision-making on which intellectual property to maintain. The answer was to make the process simple and sustainable by using “value” maps, “use” maps and three Sigma analysis. These tools solved the problem of poor organizational memory and provided context for decision-making. Another need P&G had the time, because of pressure to improve earnings from all assets, was a way to focus on extracting value from intellectual property that included licensing, donation and other avenues beyond internal commercialization. The solution to this need was to educate all levels of the organization on the lognormal distribution value of intellectual property, and its implications, and then to deploy P&G resources accordingly. Previously P&G had been behaving as if the value of its intellectual property was uniformly and normally distributed. Finally for the 10% of the art that P&G was using, there was a need to improve filing of reissue, continuing patent applications, and continuation in part applications. To do so required upgrading of the intellectual property review process during the R&D stage and gate reviews, and including business input and participation at intellectual property gate reviews.
What is needed to improve a Corporation’s productivity and integration of intellectual property management with business management are processes that: (1) ultimately dispose of intellectual property, (2) utilize business processes which will permit extraction maximizing the value from intellectual property as well as (3) permitting the R&D function to operate as a center of excellence within the corporate structure. Business model options are several. First is dividing up the employees and intellectual capital assets of the corporation among the business units of the company, second, create a profit / loss unit within the company, or third create a stand-alone business wholly or partially owned by the parent company.
To make the best choice, some basic concepts need to be well understood by the business, R&D, and intellectual property teams. These include the IP management hierarchy, how patents are organized from the “use” perspective, and how patents are viewed from the “value” they create. The patent portfolio must also be viewed vis-a-vis those held by the business competition in three main areas. These include the patent portfolio health, the patent portfolio velocity direction, and the technology or innovation organization as a center of excellence.
IP Management Hierarchy Pyramid

To embed integrated work processes in an organization is not however an easy task. The overall objective is to evaluate and provide upgrades to the company’s IP culture, work processes, and toolsets. The goal is to create, maintain, and extract value from intellectual property in a way to the Corporation becomes a visionary intellectual property company is defined by the “IP Management Hierarchy Pyramid” as shown in the figure developed by Gathering 1 companies. Consistent with this objective is to obtain full value from the corporation’s intellectual property at the lowest cost. This includes reducing the number of patents that are abandoned and increasing those that are licensed. It also involves improving workflow efficiencies especially for the top technical and management personnel in the Corporation.
Building from (1) using the IP management hierarchy pyramid as mean to set the overall posture of the IP function, other overall management processes also need to be in place. These include (2) using R&D and licensing decision matrix tables, R&D and IP process flowcharts, software tools for detailed work, and (3) upgrading the sophistication of IP review during R&D gate reviews and conducting business reviews at IP Gates.
Other major changes involve providing tools for intellectual property management. These included (1) building standard templates for R&D gate reviews and IP decision reviews; (2) keeping IP strategies visible and easy to understand; Putting IP strategies in context; Utilizing the value view of IP in the patent / product / revenue matrix graphics for decision-making, and (3) making IP maintenance process simple and sustainable by using value maps, use maps, and three Sigma analysis.
Relationship Between Business and IP Needs
Truly integrated processes however also involve excellent communication skills. Communication of IP processes comprises three elements. These are: (1) educating all levels of the organization on the lognormal distribution of value, its implications, and deployment of company resources accordingly, (2) selecting what forms of intellectual capital to track, and (3) using a mixture of software and wall maps as the best approach to allow access to IP related information.
By putting in this effort companies are able to easily understand if the portfolio is meeting the needs the Corporation. Top management can also understand whether or not the Corporation is extracting full value from the portfolio and if the portfolio reflects the Corporation’s current business strategy.

The first step in integrating IP and business processes is to use the IP management hierarchy to match the five primary business needs with the corresponding IP needs that the company’s processes need to fulfill. This is shown in the “Relationship Between Business and IP Needs” figure. Using this figure starts at the bottom of the pyramid which is analogous to Maslow’s hierarchy of “needing air to breathe” as a primary need. The concept is that each business and corresponding IP need at the bottom must be met and fulfilled, in an 80/20 sense, before it’s appropriate for an organization to move onto working on fulfilling the next higher business need. Thus the primary business need of “never to surprise” the board of directors or shareholders takes precedence over all other needs. CEOs, directors, and managers who fail to keep this priority often find themselves without a job. The corresponding IP need is to make sure that the company has freedom to operate. Failure to do so can result in company death and unemployment for employees. Moving up the ladder, the next business need is to sustain an advantaged market position. This can be done by a variety of techniques, but the role of intellectual property is to make sure that protected products are created and that the portfolio of intellectual properties is well-managed. Only when these first two levels are under control and operating smoothly can a company go on to fully exploit all of its assets including the geographic out-licensing of intellectual property. Because of business competition, the next need of a Corporation is to speed its introduction of new products and services. Licensing is a vehicle where intellectual property personnel can contribute to open innovation initiatives. Finally, for companies that are able to achieve the highest level of being able to influence the industry on the adoption of which new technologies are appropriate, they needed a team of integrated business, regulatory, standards, R&D, marketing, and IP personnel to do so.
Methods of Accelerating Innovation and Product Development

For efficient IP and business integration to occur it’s best to start the integration during the R&D process. The “Methods of Accelerating Innovation and Product Development” figure shows five means of acceleration and how four aspects of the development phases can be accelerated. The last column includes how intellectual property process can be used to advantage. Each box in the matrix should be given equal consideration.
R&D Funnel Map

If the R&D organization is using stage gate process the best points of integration are at the gate reviews as explained earlier. If it is using an Agile or Lean Process the best integration point is during the review process at the end of a scrum. By way of example, as shown in the “R&D Funnel Map” figure, the number of projects decreases going through the funnel, from ideas to commercialization, whereas the number of opportunities to capture intellectual property and spin out as licensing opportunities increases. It’s important that each gate review that clear decisions are made on which ideas are to be captured in which forms of protected or licensable intellectual property.
Agile / Lean IP Integration

As shown in the “Agile/Lean Integration” figure, the goal of the IP supporting personnel should be to integrate their activities into the agile development methodology. This means the project development team should be IP-educated before entering into the planning phase where initial IP priorities are identified. In the sprint phase, inventions can be mined and in the user review phase, provisional patent filings are made. During the retrospective phase, IP protection strategies can be reviewed, confirmed and finalized. Using this rhythm, each iteration of the agile project provides a subsequent opportunity to further refine the IP capture/protection strategy. The resulting product can then be reviewed prior to release to identify further opportunities for (domestic and international) patent filings and other protection mechanisms (e.g., trademark and copyright registrations, end-user license agreements, etc.).
IP and Business Alignment
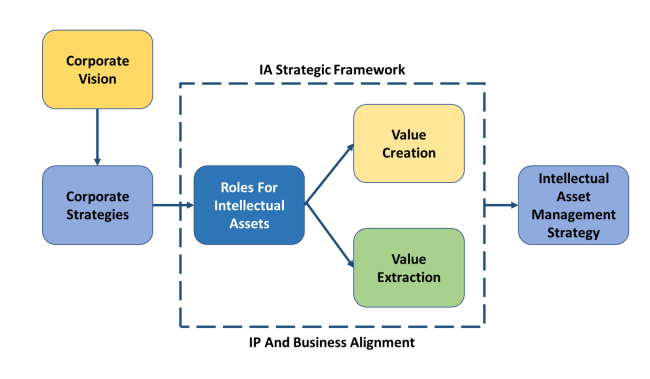
To make the decisions between which art to keep internally in which to license out there needs to be a clear understanding and articulation of the business vision and strategy with respect to IP. This “IP and Business Alignment”, as shown in the figure, is critical if just the right amount and type of IP are to be created and maintained. Companies have gone astray here over the years by thinking that they will be able to extract value from extra intellectual property. In fact, if the technical in innovation organizations are well aligned with the corporate vision and strategies there is little extra art created. These companies make most of their money by selling in the marketplace their own internally developed products and services. It is only, on the other hand, corporations which by design are going to license out their products and services, as for example 3Com, that the value extraction effort needs to be fully resourced.
IP Process Flowchart

By looking at the complete ”IP Process Flowchart” figure, the integration with other business functions is easily seen. The concept or patent analysis must be coordinated with the information services group. The assertion analysis phase is done in conjunction with the marketing and legal groups. In-licensing is done with the open innovation and technical groups. Creating and expanding intellectual property is typically done with the innovation or technical groups. Out-licensing requires the legal, marketing, technical, and licensing organizations. Assertion negotiations and litigations require the general management, technical, marketing, and negotiation teams. Donations require tax, marketing, and technical interfaces. Abandonment requires interfaces between general management, technical, and marketing. Maintaining IP requires general management, marketing, technical, and intellectual property teams.
Leaving knowledgeable individuals out of any of these process steps may at the time appear to be saving time and money, but in fact studies by the Industrial Research Institute and Licensing Executive Society professionals find it is much more productive to include all the necessary individuals in a well-designed meeting to make final, high-quality decisions, quickly and productively.
Multiple Business Uses of Forms of IP

One of the primary reasons why it’s important to integrate business teams into intellectual property management is that different forms of intellectual property have multiple uses as shown in the “Multiple Business Uses of Forms of IP” figure. The primary forms of intellectual property that most for-profit corporations hold are patents, trademarks, copyrights, know-how, and relationships. Each of these forms of intellectual property has defensive uses, in conflict avoidance and dispute resolution. They also have offense of uses where they can generate revenue in their own right, reduce costs to the Corporation, and allow for strategic positioning of a company. To reiterate, leaving out personnel who have the business insight as to how each form of intellectual property can be used in their area of the business creates either decisions that do not extract full value from the asset for the Corporation, or perhaps worse, personnel are endlessly accounting for and debating the merits of each intellectual property asset. Thus quick, high-quality, and sticky decision processes have to be applied in intellectual property management if it’s to integrate well with business processes.
Lognormal Distribution of IP Assets’ Values

An important integrated intellectual property and business process is to create a lognormal distribution of value of intellectual property assets. The reason for doing so is that Edward Deming found that when values were over three standard deviations from the group average special cause was involved. This is his famous three Sigma test that drove improvements in the quality movement for decades. When applied to patents, this test shows how few are special in terms of likely strength and value, and should receive special attention from the Corporation. A classic example of this was mentioned in the Procter & Gamble example where only 10% of their intellectual property assets were being used. Many other Gathering 1 corporations conducting similar studies found that not only 10% of the patents were being used, but more like 5% of the patents they hold are creating value for the Corporation that a shareholder can see. This is shown schematically in the “Lognormal Distribution of IP Assets’ Values” figure. Guidance coming from this figure is that there are very few patents of high value to the Corporation that are protecting profitable commercial products and services. The bulk of the art that the Corporation possesses provides image protection that enables the business to sell at slightly higher price points to customers and/or is available to license out to others. For unmanaged portfolios there is a significant amount of art that can be divested or donated.
A fast way to establish relative value of intellectual property is to use the following three tools. These are use map, product revenue patent tables, and a value map. These tools have evolved because they provide a fast and efficient way to value IP for internal business decisions.
“USE” View of Patent Portfolios

The first tool to use is that of a “USE view of Patent Portfolios” as shown in the figure. For large corporations the vertical axis is used to segment the different business units of a large corporation (or business lines of a small company) in a range from those that are mature to those that are new ventures slated for growth. Across the top of the matrix are columns that categorize if the intellectual property, in this case patents, are being used commercially today, is in the business unit’s operating or strategic plans, is potentially strategic (being developed in R&D or in open innovation negotiations), or lastly, is outside the strategic business vision.
Inside the matrix we find that that art which lands in the upper left quadrant is slated for intellectual property growth via patent fences and continuing patent applications. The upper right quadrant contains art that can be effectively licensed outside the Corporation as it would protect new business opportunities that the company does not wish to pursue. Art in the lower quadrants is usually best abandoned or donated as mature businesses are often protected by brand-name and a dominant market position.
Typical Segmentation Seen in “USE” View of Patent Portfolios

Shown in the “Typical Segmentations of Portfolios in “USE” View” figure is the amount of art in a large company’s portfolio that falls into each area of the matrix. This was first done for Dow Chemical Corporation the later confirmed by many organizations represented in the Licensing Executives Society. Note that once a portfolio comes under active management the amount of art suitable for abandonment drops to less than 5% and the art available for licensing drops to less than 10%. This is because once business line and intellectual property management personnel are incorporated into the R&D and innovation organization development processes, the innovation efforts become well directed and aligned with the company’s plans.
Example “USE” View of Patent Portfolios

In the “Example of a Small Bicycle Seat Portfolio in “USE” View” figure, ten patents held by a bicycle seat company were plotted on the USE view. The company can quickly focuses efforts on building out art in its growth position as represented by patents’423, ‘806 and D’905. Viewing patent portfolios in this manner by general managers has been shown to be a quick and easy way to gain their understanding of their patent assets and obtain their buy-in for the appropriate resourcing of personnel to improve their patent portfolio. It also gives them a better understanding of which part of their portfolio is really adding value and which is not.
Of note is that a group of company professionals was able to place these 10 patents on the grid in approximately 15 minutes. Insight gained from the time expended using these tools is very high.
“Value” View of Patent Portfolios

Once art that is covering commercial or strategic products or programs is understood the next tool to be used is the “VALUE view of Patent Portfolios”, as is shown in the Figure. This mapping of patents was created by a pairwise comparison of the products or technologies claimed in each patent. The pair of patents under consideration is placed to the left or right of one another depending upon the relative cost of producing the claimed product or service is higher or lower of the pair. The vertical positioning of the two documents has to do with the relative performance that the claimed product or technology would have vis-à-vis the other. The performance is a subject matter expert’s view of the relative quality, service or design elements in the eyes of customers. Teams of technical and marketing personnel can typically place 30 patents on a grid like this in under an hour.
Even though the individual team members have to read the patents’ claims segmenting pairs of art isn’t as hard as it looks. The reason for this is that the work is done in a pairwise comparison manner. The human mind is very quick when it only compares two things against one another. It is when you give it three or more objects the process slows down considerably. Ideal for this type of analysis is to place the front pages of the patents on a large table on which the axes of Relative Performance and Cost have been laid out.
Example “Value” View of Patent Portfolios

The “Example of a Small Bicycle Seat Portfolio in VALUE View” figure shows how the ten aforementioned bicycle seat patents lay out on this grid. Note that the two of the patents have European and Japanese counterparts. In this case the company should very much focus on the ’806 and ‘423 patents. These patents cover features highly valued by customers and for which the company will be able to deliver to customers the product at a cost lower than competitors. Art below the line can either be licensed or abandoned. The preference is to try and license art in the lower left quadrant and abandon that art in the lower right. The logic for the latter is that there are very few companies that would want to license relatively low consumer value art which would cost them a lot of money to produce.
Example of a Patent / Product / Revenue Table

The final tool to integrate intellectual property and business decision-making is that of a “Patent / Product / Revenue Table” as shown in the figure. This figure is created by integrating the financial information from the company books, with its manufacturing tracking system, and the patent / product information coming from its IP database into one unified report. This may easily be done today with most manufacturing resource planning tools. This chart shows for each patent how much of the company sales revenue is being covered. The portfolio team can see at a glance which patents are protecting revenue streams and which are not. Those not protecting revenue are subject to a decision to license-out, donation, or abandonment, as consistent with the USE and VALUE map positions.
The reason for using such a Patent / Product / Revenue Table is it there are some products that a company produces that are covered by patents that turn out to be unprofitable or have very low sales revenues. Protecting these products with expensive intellectual property is not a wise business choice. Thus although the patents may show on the USE grid they can be abandoned as it is not likely that competitors would want to spend resources to enter a small unprofitable market.
It should also be noted that many manufacturing resource databases can first be sorted by product profitability and product revenues. When this is possible it is recommended to do so. Once the rank ordered list is created, only the top 20% of products typically needs to be evaluated for their patent coverage. This is because for most companies the top 20% of products creates over 80% of the revenues. Applying business logic to the analysis processes can significantly reduce the time of implementation. Using insight like this is a one of the ways that makes integrating business and intellectual property processes easy and cost-effective to do.
A detailed set of flow diagrams and process steps used when integrating technology management, intellectual property and asset management, and competitive intelligence activities is provided in Chapter 15, Appendix I. Stage Gate and IP Integration Process Details.
Integrating Business Importance and Urgency with HR Levels of Thought Capabilities

There are often conflicting priorities that arise from the various business, technology, marketing, manufacturing, IP and HR viewpoints. A way to reconcile this confusion is by using Stephen Covey’s “The seven habits of highly effective people” method of time management. In his work, Stephen Covey, segmented all the tasks that a person should do in a week into four quadrants. These are shown in the “Important Versus Urgent” figure. His method can be adapted to project management by taking all the projects that an organization has in front of it and mapping them on the same type of matrix.
The two main criteria on which you evaluate projects are their urgency and importance. Urgent activities require immediate attention. Important ones contribute to the organization’s mission, values and goals long-term. You want to focus most of your energy and activities those activities that are important and but not urgent, i.e. Quadrant 2. According to Covey for personal work, Quadrant 2 includes relationship building, recognizing new opportunities, planning, and prevention. For organizations that are undergoing new product and service innovations, Quadrant 2 is often the strategic projects aimed at changing the industry, or adapting to long-term industry environmental factors. For organizations, urgent and important things tend to be crises related to current product problems and regulatory issues. Not important and urgent projects are often requests coming from top management for their understanding of what’s going on. The busywork in Quadrant 4 often relates to in-process metrics and activities required by top management. Dividing up an R&D organization’s time and activities on this matrix often shows that there is too much work going into Quadrants 1, 3 and 4 as opposed to Quadrant 2.
It is not easy however to just simply decide to focus more energy on Quadrant 2. When looking at the capabilities of an organization, what senior innovation management leaders find is that they don’t always have the mental processing capabilities present in their organization’s personnel to deploy them all on Quadrant 2 activities. There are often not enough high-thinking-level personnel to go around. These constraint resources are often overburdened if senior management isn’t careful. This is especially true for organizations that need to change because of industry or environmental conditions. Senior managers are often slow to make the personnel changes needed to undertake these activities. The other problem with Quadrant 2 work is that it is hard mental work. It requires both mental and physical effort and discipline. Again most people and many senior managers do not have the mental capability themselves to guide an organization in a way that they spend most of the resources time in Quadrant 2 activities. Instead they find that they often ask the organization to do things important to themselves, which are really Quadrant 3 and 4 activities.
Capabilities, Importance, and Urgency Tradeoffs

A way to help improve the situation is to take Covey’s original two-dimensional matrix and add a third dimension. The third dimension is the creativity required for the project (or the level of thought as explained in Chapter 4). The “Capabilities, Importance, Urgency” figure shows this.
When laying an organization’s projects out using these three dimensions, the nature of the difficulty of the Quadrant 2 projects becomes apparent. Since many people have difficulty understanding three-dimensional graphics, color bubble diagram are sometimes substituted. In color bubble diagrams the size of the bubble shows the number of professional people working on a project and the color of the bubble shows the level of creativity likely required for success. The “Resources Capabilities Importance Urgency” figure shows this.
Creativity, Importance, and Urgency Tradeoffs

In this figure it can be seen that there are a number of project’s requiring low levels of creativity, as represented by the green and blue circles. It makes the most sense for organization to tackle these projects quickly and achieve the business returns that result. The more difficult projects requiring the yellow, orange and red levels of high creativity should be tackled second. Again the issue is typically the limited number of high-thinking-level personnel available (the constraint resource).
The advantage of displaying projects in the colored bubble format is it allows everyone in the organization, from professional staff to senior managers, to understand the appropriate challenges and processes to be used in tackling each project. It also allows senior managers to see that some of their highly important and urgent projects may nonetheless require more internal and external resources than they originally envisioned. To have an extremely productive organization, its important senior managers understand these patterns and communicate realistic expectations to the organization (especially project leaders).
Intellectual Capital Valuation Processes

In the knowledge economy, more than 80 percent of all assets of companies are intangibles i.e. Intellectual Capital. Determining the real value of these assets is crucial to any investment decision. Thus it is critical for a company to obtain a fair valuation of these assets, be it either a corporation or venture. Removing the information gap between investors and the investment reduces the risks and uncertainties for the benefit of both.
A company’s Intellectual Capital (IC) is usually determined as the sum of its human capital, structural capital and customer capital. Areopa, a European company working in this field has utilized a structured and standardized asset valuation methodology underpinned by accurate econometric appraisals. The methodology also benchmarks the wider environment and industry trends for improved accuracy. The methodology which is compliant with international Accounting Standards provides a framework for managing IC (i.e., for identifying, securing and adding controls and eventually transforming IC into tangible assets). As intangible assets are converted into tangible assets corporate value stated on the company or venture’s books increases. The “Current and Future Assessment” figure shows at a high level what is involved.
4 Leaf Model of Intellectual Capital Valuation

The evaluation process first starts with assessing the companies work processes and business model understanding in 15 different areas. Gaps are found between the company and the best-practices of competitors. The financial value of these gaps is also determined by knowing from a competitive dataset, how much book value similar entities are listing for each asset. See the “4 Leaf Model” figure.
Using a structured approach to filling the gaps and building long-term value creation enables companies to increase their balance sheet value by improving their business. Using such an integrated view of all forms of a company’s capital is a fast and effective tool for companies to evaluate their current business model. It is holistic and comprehensive. It reveals both issues and potential of a company.
When a company conducts such an IC assessment, it details the various assessment areas individually and in a summarized format. The report should include an estimation of current and future value of the company based on tacit vs. explicit knowledge area analysis and conversion potential. A full IC monetary calculation covers all the IC assets of a company ( 77 IC asset categories in total ). The assessment will also typically list main knowledge and IC gaps and problem areas identified in the analysis process, as well as a section of tailor-made recommendations in how to narrow or close these gaps.

A full new IC accounting system, called IICARuS ( Integrated Intellectual Capital Accounting and Reporting System includes IC journal entries, IC accountable events, IC ledger, IC valuation rules as well as IC accounting rules that are consistent with the IAS & IFRS 37/38/36 accounting standards. In these standards ”IC= added value minus costs”. In the past, the financial standard was to interpret many IC assets as costs but they are now redefined as added value, in keeping with the 3 basic criteria of the standards: (1) Identifiability, (2) Controllability, and (3) Future economic benefits. The “Integrated Intellectual Capital Accounting System” figure shows schematically how this is achieved.
Of importance to new ventures or companies is that using this framework, is the ability to identify more than 100 “ IC application areas”. These are detailed and proven areas where IC proves to be a big added value contributor. Based on tests with at least 200 companies per application, these high-leverage areas were ones where new companies can focus their energy to increase their valuations markedly between funding events, i.e. A, B, and C rounds.
Sources, References and Selected Bibliographic Information
1. “The 7 Habits of Highly Effective People”, by Stephen R. Covey, 1988.
2. “IC White Paper”, by Ludo Pyis, Areopa Group, http://www.areopa.com
3. “Integrated IP and Business Processes” IAI White Paper presented to P&G staff, April 23, 2002
4. “Use view of patents”, Gathering 1, circa 1995
5. “Value view of patents”, Gathering 1, circa 1996
6. “Patent / Product / Revenue Table”, Gathering 1 and DuPont Corporation, circa 1997
7. “Fourth Generation R&D, Managing Knowledge, Technology, and Innovation”, by William Miller and Langdon Morris, Wiley, 1999
8. “A New Fourth Generation of Innovation Management Theory & Practice, Parts 1 & 2”, by William Miller, Journal of Value Creation, July 2015
9. “The Startup Owner’s Manual: The Step-By-Step Guide for Building a Great Company”, by Steve Blank and Bob Dorf, March 2012
10. “Discovery-Driven Planning”, by Rita Gunther McGrath and Ian MacMillan, Harvard Business Review, July-August 1995.
11. “Business model generation”, by Alexander Osterwalder and Yves Pigneur, Strategyzer Series, July 2010
12. Gathering 1 companies were a dozen Fortune 500 organizations that met twice a year during the late 1990s to create and evaluate best-practices for Intellectual Asset Management. Many of their findings were incorporated into the LES Fundamentals and Intermediate course materials offered world-wide.
13. “Edison in the Boardroom”, by Suzanne Harrison and Julie Davis, Wiley, 2002
14. “Edison in the Boardroom – Revisited”, by Suzanne Harrison and Patrick Sullivan, Wiley, 2012
15. “Einstein in the Boardroom”, by Suzanne Harrison and Patrick Sullivan, Wiley, 2006
16. “Intellectual Property Lawyering – In The Fourth Industrial Revolution (The Internet Of Things)” by Raymond Millien, Chief IP Counsel, GE Oil & Gas, Houston, TX and Christopher George, Partner, Hanley Flight & Zimmerman, Chicago, IL, Innography White Paper, Feb. 2018
17. “Innovation for Business Growth”, by William Miller, Research Technology Management, Oct. 2001
18. “A Broader Mission for R&D”, by William Miller, Research Technology Management, Dec. 1995
19. “A Survey of Major Approaches for Acelerating New Product Development”, by Murray Millson, S.J. Raj and David Wilmon, Journal of Product Innovation Management, 9:53, 1992.
You must be logged in to post a comment.