
Managing Technology Projects
- Determining a Project’s Maturity and Resourcing
- Managing Horizon 1 and Process Improvement Projects
- Identifying High-Potential Projects
- Utilizing Patents to Enhance Project Direction
- Using Innovation Sprints to Improve Product Development
- Role of the Project Leader
- Using “R&D Game” Insights to Set Project Parameters
- ”Stage/Gate” Project’s Gate Audit Check and Voting
- ”Stage/Gate” Project’s Progress Tracking
- Program Management Tracking Tools
- Appendix I. Detailed Horizon 1 Project Management Process
- Sources, References and Selected Bibliographic Information
——————————————————————————————-
Determining a Project’s Maturity and Resourcing
There are times when an organization is presented with an innovation opportunity from outside the Corporation. This can also occur internally when a person or a team comes up with a new idea and presents it to management for consideration. In such cases it is useful to quickly understand where the project or idea stands in its journey from birth to maturity. A quick way to assess such projects is to first assess which part of the market (from a maturity standpoint) would be targeted upon product or service introduction.

Using the “Adoption Cycle” figure, the market segment that the product or service will target upon introduction can be categorized. It ranges from Innovators who are willing to take risks and adopt technologies that may ultimately fail. Innovators are followed by Early Adopters who also adopt technologies early, but they are more discerning than Innovators in their adoption choices. The Early Majority will adopt an innovation after significantly longer times than Innovators or Early Adopters. They wait to see if the technology really works and is reliable before buying. It was Geoffrey Moore who described the distance between the Early Adopters and the Early Majority market as a “chasm”. The Late Majority segment is even more skeptical and adopts innovation only after the average customer has already purchased it. Laggards are the last group to adopt an innovation. These individuals typically have an aversion to change.
Really new ideas should be tested with Innovators and Early Adopters. This is because these people are happy to take risks with early versions of a product and are more than happy to give feedback. There is also less brand reputational risk for a company if it starts working with Early Adopters before targeting the main market. After testing and obtaining confirmation that the products really work, the products can then be taken to scale via the Early Majority. During this phase is the opportunity to chance to test the growth engine and traction metrics. When the Late Majority starts using the product you’ve achieved scale. It is now time to think about renewing the business model and refreshing the product line.
So if a company is presented with an opportunity for new product, thinking about which of these market segments is the target can easily segment the opportunity, thus framing the resources needed for its commercialization.
Innovation Frameworks for Project Management

Another segmentation method is using either the stage and gate funnel model or the agile / lean innovation framework model. In the ”Innovation Framework” figure, ideas move through problem-solving and business model generation onto commercialization. One of the great things about having these frameworks that map an idea’s journey towards commercialization is that these frameworks can map any product, idea or existing, in terms of where it is on its innovation journey. This helps communication among all stakeholders so everyone is on the same page. If the project is coming from outside the Corporation, or is been newly introduced to management by an internal source, the first challenge for management is to determine where upon this journey the idea is. Sometimes technical innovators come up with a new chemical, commercial product, or software algorithm for which no known commercially use case exists. This is quite distinct from innovations that are presented which are technically new, but familiar to the marketplace.
Innovation Stage Mapping Survey

One of the best ways to answer the question of where project is in its innovation journey is to use the questions in the “Innovation Mapping Survey” figure. After the questions have been answered, the key at the bottom of the survey can be used to determine (by the distribution of the yes answers) where a project is in its innovation journey. By knowing this, a project can be initiated in the proper Stage in the Stage / Gate or Agile / Lean process. Given the position, the appropriate number and kind of resources can also be allocated to the project team.
Managing Horizon 1 and Process Improvement Projects
Because of the comparatively low level of innovation required for Horizon One and Process Improvement projects, these projects can be started from lists of identified opportunities. These lists typically come from key customer requests, marketing and business development personnel, trend analysis, competitive intelligence, process flow analyses, operations benchmarking, or Pareto analysis. The identified opportunities can be prioritized by using a importance versus urgency versus creativity matrix as described in Chapter 15. The opportunities that are urgent, important and require low creativity obviously come first.

Once the identified opportunities have been prioritized, the next step is to form a project team and scope out the specific project. The tools used for process improvement projects are shown in the “Process Improvement Problem-Solving Model” figure. The tools used are primarily those developed for statistical process control of manufacturing processes. Full Quality Functional Deployment and Statistical Process Control methodologies are not meant to be described here, but it is important to mention from a project management standpoint which tools the team should be familiar with and utilize. When scoping the project, this starts with Tree Diagrams, Establishing the Project Boundaries, and Quality Functional Deployment House of Quality Matrices.
In the third step, analyzing current processes to determine if there is statistical control or not is done via process flow analyses, and checklists. Analyzing the available data can be done by hand, but it is much preferred to use regression analyses for moderately complex processes and artificial intelligence engines to mine data for patterns in complex processes.
The last step in this part of the problem solving model is to define carefully the outcomes for the desired improved processes. This is where project leader skills are important. He or she must make sure all stakeholders are involved and that there is true agreement on the goals of the project. Completion of this step is achieved when all the important dependent variables and their desired parameters and been defined.
The next step in this type of project is to identify root causes and proposed solutions. The tools to use here are brainstorming, why-why diagrams, process redesign flowcharts, Kepner-Tregoe analyses, decision trees, failure modes and effects analysis (FEMA), and different types of Delphi and nominal group techniques.
In testing the proposed solutions it’s important to make sure that the experiments are designed properly. True Design of Experiments methodology should be used. An important tool mentioned in earlier chapters is that of desirability functions. When experiments are run the results should be displayed on the desirability function graphs as well as the interactions between all of the independent variables displayed using response surface modeling.
As the best solutions emerge, the project should recycle back to identification of root causes and proposed solutions (because the project goals have not been met) or move on to implementing the solutions and measuring the progress (if they have).
The last and perhaps most important step in this process is to acknowledge the team and communicate the final project results to everyone. This is true of all projects, not just Horizon One and Process Improvement ones. Ensuring that the team feels valued and that all in the organization understand that success is rewarded is critical to improving employee, supplier and vendor morale.
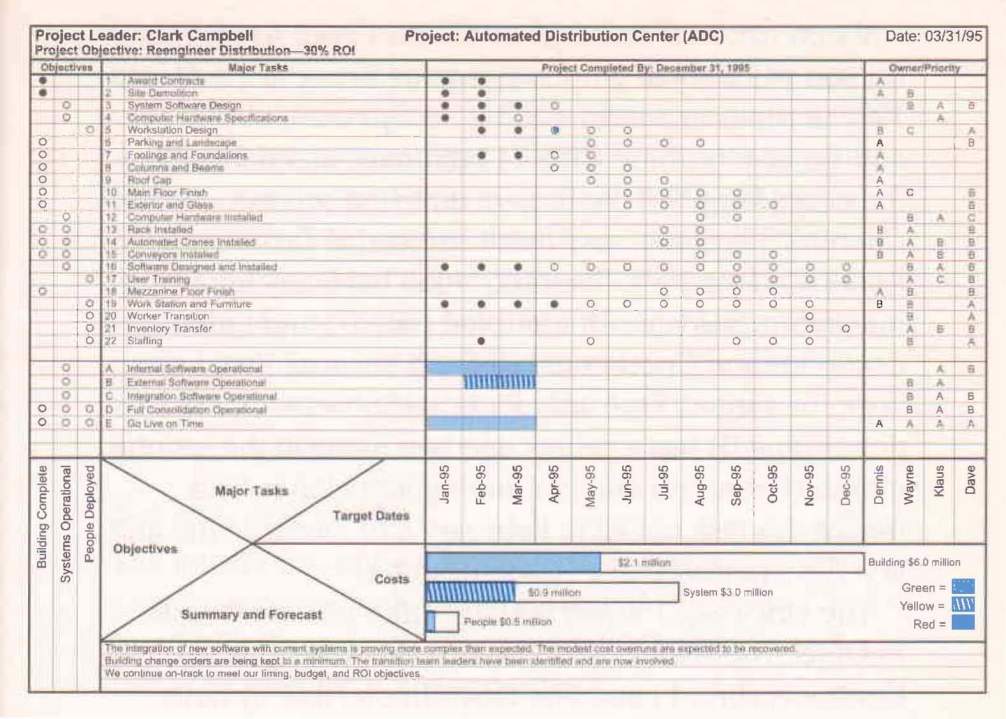
A detailed project management process is provided in Appendix I. Also for Horizon One projects the one page project manager approach is really valuable. A completed example of such a one-page document is shown in the “One-Page Project Summary” figure. .
Identifying High-Potential Projects
A process for identifying those new business development ideas with a higher than average probability of success, was developed at the Hoechst Celanese Corporation Office of Innovation. They reviewed more than 1000 ideas generated through their Idea Fund and Opportunity Bank in order to come up with a way to improve the survival rate of ideas going through the Hoechst Celanese stage gate process. Their opportunity enhancement process was based on research and venturing process of Dr. Rajiv Tandon, a professor of entrepreneurship at St. Thomas University in Minneapolis Minnesota.

The opportunity enhancement uses a series of questions, called screens or cuts, to identify high potential ideas. The questions helped the teams consider the idea from broad range of perspectives, before any money was invested. The process is shown in the “Overview of Opportunity Enhancement Process” figure. This process enables groups or individuals to screen a large volume of ideas quickly and methodically. The process identifies high potential ideas and allows others to fail quickly and cheaply, on paper instead of in the lab. Opportunity enhancement also strengthens the emerging concepts and provides a flow of improved ideas back into the process.
This process works because it sets boundaries upon all the ideas that come in. In the First Phase market scope is conducted to see if the idea falls into the existing product lines for the corporation, or product lines were the Corporation intends to grow. The best sources of ideas came from customer problems, internal problems, competitors’ problems, social interactions, reading which identified unmet needs, and frustrations the Corporation experienced with its consumers. Less productive in generating ideas were environmental scans and futuristic reports, and efforts focused on creating one good or profitable idea.
When a user submitted an opportunity, the first task was to fill out the question zero worksheet. A set of questions are asked and answered utilizing an anchored scale for each. If the following questions can be answered with a positive answer, the questioners are scored with +2 points. If the question needs more information in order to be answered, it gets +1 point. If the question has a negative answer it’s given no points.
The questions are segmented into Description, Reward, Risk, and ROI categories as shown below.
Opportunity Description
Does it fit the Corporation’s business environment?
Do we have the resources to implement it?
If we do not have resources, could we get them through joint venture, licensing, etc.?
What would we make or sell?
Are niches available?
Would we have a sustainable advantage (via some form of IP or business position)?
Upside Potential
How large is the market?
Is it growing?
How profitable is it?
What market share might we capture?
How would the business be structured (JV, acquisition, etc.)?
Would we have a cost advantage?
Would we have legal protection (patents, licensing, trademarks, etc.)?
Limited Downside Risk
Will the business be cyclical?
How new is the technology?
Does it fit our technical expertise?
How great is the technical risk?
What would be the magnitude of any loss?
How forgiving is this business?
Harvestability
How long would it take us to break even?
How soon can we have a positive cash flow?
Is this a business we could eventually sell?
Would we develop technology that we could license to others?
These questions are answered by small groups of individuals. These individuals usually consist of 3 to 5 people. Individuals compare their scores and discuss them looking for points of view that others may have missed. After an evaluation session, each breakout group produces a listing or spreadsheet of the ideas segmented into three categories. These are those that have support by unanimous agreement, those ideas that have support by consensus after group discussion, and those ideas that most members in the group rated negatively.
Although there is not much information to be used as a basis for the ratings, if the small groups are comprised of individuals from sales, marketing, manufacturing, technical, and legal, the groups’ gut reaction is just what’s needed. At this stage in the process the results are not intended to be quantitative. Depending on the ideas submitted, a Question Zero Review can have a high attrition rate. Celanese found that at times 90% of the ideas dropped out. Note that this process is best suited for Horizon One or simple Horizon Two projects. This is because the technology and the business model needs to be somewhat familiar to the group. For Horizon Three product ideas, for which the technology and business models are not known, this process is inappropriate.
Preliminary Screen for Identifying High-Potential Projects
The next step in the process is to do a first cut or preliminary screen. The screen consists of six Numbered Questions each with a list of “for consideration” questions to guide thinking. Instead of actually answering the Numbered Questions in detail, the only thing the small groups doing the evaluation needs to consider is “how weak or strong the ideas are” from the perspective of each of the “Numbered Questions” based on the underlying “for consideration” questions. Points based on a 1 to 10 scale are used for each of the six Numbered Questions, answered by small groups. No points are assigned to a question if the idea is so weak that the company should forget it, or 10 points of that aspect of the idea looks outstanding. The maximum 60 possible points indicates an opportunity with an exceptionally high, almost certain potential for success, however most scores run in the middle of the range. As in the first part of the process, several small groups of 3 to 5 people produce the best results.
The six Numbered Questions are:
Is It Really An Opportunity?
Why does the business opportunity exist?
What products or services will the company make and sell?
Who will use them?
Does the company have access to the potential customers?
How will a customer use the product or service?
Is it a real need?
What are the potential customers doing now?
Is our offering significantly better?
Is there an opportunity for expansion and growth?
Does The Opportunity Fit You Personally?
Do you believe in the concept?
Does the need it fills mean anything to you?
Is the idea begun to take over your imagination time?
Do you have, or have access to, the necessary technical expertise?
Are you a champion for this opportunity?
Who else believes in it?
Does The Opportunity Fit The Company?
What does the company bring to this opportunity?
Will the company be a credible supplier of this product in the eyes of potential customers?
Is it fit to company culture?
Does it match the company’s investment goals?
Can be profitable?
Who could spoil the opportunity?
How can we minimize those risks?
Is it a threat to competitors?
What would they probably do?
Were within the company might it fit strategically?
How does the opportunity fit with the strategy of the local Business Unit?
Do We Have The Right People?
Who are the people that can make this happen?
Does the company have relevant expertise and knowledge of this industry?
Do we have in-depth experience relevant to this opportunity?
If we don’t have experience, what linkages might we need to develop?
Would that be feasible?
What Resources Are Needed?
What would it take to develop a sample or prototype and test it with potential customers?
What will we have to invest to take the opportunity through the Gate process?
If we decide to pursue it, would development be expensive?
Would there be opportunities to save on development costs?
Will the company’s global network and resources give any advantage?
How soon could the company have positive cash flow?
We find this is not for the company, can we sell the technology or business to recover some of our costs?
Preliminary Plans
Who will take this to Gate One?
What other expertise is needed on the team?
What support will they need?
How will we enter the market?
Is the timing favorable?

From each of the team deliberations, the project scores for questions 1 to 6 are added up. Each breakout group produces a listing of ideas rank ordered by total score. The data can be collected in an Excel spreadsheet as shown in the “Preliminary Screen Scoring” figure. Another way to look at the overall strengths and weaknesses of the ideas is to plot them using a star or spider diagram. The data presented in this way allows a company can see if its ideas are generally stronger weak in one or the other of the Preliminary Screening areas.
Having rank ordered the ideas in the first cut of this process; the top ideas are now given a closer look by looking at internal and external issues. In the second and third cuts of this process the focus shifts to some of the issues that will shape the ideas’ chances for success in the gate process. Although by definition, a team would not have all the answers at this stage, it’s still useful to ask these questions now. In the second and third screens the questions of the first cut are used, but the scoring system changes. A plus +2 score is given for a positive; an advantage, or a strong yes. The premise is that this aspect of the project is well understood; the company has a good handle on it. A plus +1 score is given for maybe; more information is needed. It’s a much weaker yes. A Zero score is given for a flaw; the project is too fuzzy to carry forward. It’s a “no” answer.
Again small teams of 3 to 5 people work collaboratively. It’s important for the groups to have cross functional membership as mentioned before. The second and third cut evaluations tend to take more time than the quick reaction answers to Question Zero or the First Cut. Breakout teams spend 20 to 45 minutes on each idea. Occasionally they may want to check a fact, consult the literature, or call an internal or external contact to get their perspective. Even though the answers are qualitative, they can distinguish highly promising ideas from those which are obviously flawed.
Opportunity Screening Worksheet


The “Opportunity Screening Worksheet – Second Cut” figure shows the detailed questions and scoring. Also provided is the “Opportunity Screening Worksheet – Third Cut” figure. During the second and third cuts, promising ideas get more attention. As the idea gains strength, evaluators may choose to make a phone call or two, or look up a few facts about the market to support the ratings. The projects are again rank ordered by total score. This allows selecting just the top projects for the final cut. However once again, taking the scores and plotting them on a radar spider diagram allows a pattern analysis to show which of the six areas are the company’s strongest or weakest. This is important for future human resource planning.
Before stopping one last cut is made. A quick look is taken at all the projects that didn’t make the third cut just to make sure that any one that has a strong individual champion doesn’t get missed. After this, the projects are again rank ordered, and those selected for a final report and insertion into the first stage of the Stage and Gate process are identified.
The following metrics are provided for one company’s experience:
Raw Ideas Screened 1180
Ideas Surviving Question Zero 130
Ideas Surviving First Cut 93
Ideas Surviving Second Cut 67
Ideas Surviving Third Cut 47
Ideas in Final Report 22
Overall Survival Rate 1.86%
Utilizing Patents to Enhance Project Direction
As business and technology development projects are initiated, it’s important to get them started in a way that will improve their chances of generating commercial success. One way to do this is to utilize patents for their ability to supply background information in the technical and market areas. They are most helpful in answering three key questions: (1) how active an area of research surrounds a proposed R&D project? (2) What are the preliminary strengths, weaknesses, opportunities and threats posed by alternative technical and business approaches? (3) How will the proposed project’s innovations distinguish themselves from known prior art?
To get started, the best approach (circa 2018) was to use a simple combination of Google Patent and Ambercite AI to create a patent database of relevant art. This particular approach is good to use in an early stage of a project because often times the key features and technologies are not well known. Google search can take a free text description of the project and find similar art to the project described. This can quickly provide a list of relevant patents – regardless of the keywords they use. The additional advantage of using an artificial intelligence engine based on citations, such as provided by the search company Ambercite, is that the first set of patents can be refined based on significant parent-child as well as aunts-and-uncles citation relationships. This is a very robust method for finding almost all art related to the project. Of course traditional methods using patent classifications and keyword searching can also be used when information scientist support is available.

Once all the patents related to the R&D project are collected they can be used to improve the technology and business proposed by the projects. As an example, in the early 2000’s a U.S. Corporation was considering entering the antitheft market. It found an example patent 5,990, 791 as representative of the art that they wished to commercialize. Their initial strategy was to license this patent, then build out a system around it. The background on this patent is shown in the “Starting Patent Related to Proposed Anti-Theft R&D Project” figure.
Looking at this background information, observations are that the patent was issued within the previous two years of the time the study was done. There are two inventors, one of which is also the assignee. This patent cited as prior art 109 other patents. It has also been cited itself at the time of the study by two other patents. The likely conclusions from these observations are that this patent has a citation pattern that is statistically associated with a valid and enforceable patent. The patent is also unique compared to the mainstream work of the field.

Looking more carefully at the two recent US patents that cited the starting point art it is seen in the “Does The Patent Represent Well-Known Art?” figure that two different entities were involved. They were Research Electronic Ink (REI) and World Color Printing (WCP). Thus the work of these independent inventors is not yet well-known or not of high commercial interest. In order to understand the importance of these direct citations it is necessary to look at what other prior art did these citing patents reference?

Starting first with the REI patent, it references 11 other US patents. The observations are shown in the “Other Citations from the REI patent” figure for the 10 different assignees cited. The references included market leaders such as Sensormatic and Checkpoint. Also present were market participants ICI Americas and Esselte. It can be concluded that field is active and not crowded. When looking at the dates of these cited patents it somewhat surprising to find the cited art is 9 to 30 years old. An exception of course is the starting patent of interest. Thus this art has a pattern that is associated with art that is not likely to be a problem from a prior art standpoint. The mix of dates of art indicates that the latest work could be start of a new wave of inventive activity, based on a twist of the Dominant Design. Since the number of patents in this case is small, the R&D project team can read each of these patents to determine the validity of these tentative conclusions.

With respect to the World Color Printing patent, there are 19 different assignees. The notable assignees are Avery Dennison, Sensormatic, 3M, and Wallace. The conclusion that can be drawn from these citing entities is that there is interest from RF tag manufacturers. Given the multiple citations from several of the top participants indicates that the art they have filed may cause problems for the R&D team. The field is definitely active but not too crowded. To dive a little bit deeper into this, the age of the cited art was studied. This art is from 1 to 5 years old, thus relatively recent. The conclusion that can be drawn for the R&D team is that this art has a pattern associated with art that may be a problem and needs a quick legal review. It also indicates that the preliminary conclusion from the previous REI art that “this could be the start of a new wave of inventive activity” is unlikely. It is important to note that the power of undertaking patent-based analyses at the start of an R&D project is that multiple conclusions can be drawn and tested during the study. When the study is completed all the conclusions can be taken together in order to formulate the best possible picture of the strengths, weaknesses, opportunities, and threats that the R&D project faces.

In this example study it turns out that the amount of prior art is manageable. The R&D team can easily read this amount of prior art and segment the information disclosed into relevant technology, product, features and business model segments. Once segmentation is made the patents can be sorted into those that represent opportunities and threats for the R&D team to consider. An example is shown in the “Segmentation of the Technology, Features, and Business Models in the Prior Art” figure. Of most importance in this particular example would be the four patents related to the “alarm” segment.
There are many clustering tools available that can automatically provide such segmentations. These are particularly valuable when the number of patents to be reviewed is large. In this example case there were 918 such patents. By looking at the assignees of these patents it was found that the market leaders dominate. Independent inventors such as those of the starting point patent are also very active with approximately 28% of all patents. This intellectual property “forest” raises the question of whether or not the field is actively growing or has it already matured. If the former, it is a good time for the R&D team to get involved with this project. If it’s already maturing this may not be a viable commercial area to invest in.

Good way to quickly determine the answer to this question is to sort the available prior art by year of publication. As shown in the “Prior Art Sorted by Publication Year” figure, this field is growing. The growth is been steady and has not yet matured. Looking at the consistent growth it can also be concluded that this is constant innovation, most likely incremental, and that no breakthrough to a new dominant design has yet occurred. This is important for the R&D team’s understanding of how its new product will be received by the market. Given this growing body of work occuring alongside the company’s R&D project, it’s important for the team to also realize that a good potential exists that there will be more inventions around their own work. They will need to protect any novel approaches they create.

To see where the industry has focused its attention over the previous years, the top 10 most frequently cited patents are identified. In the “Top 10 Most Frequently Cited Patents” figure, it can be seen that the industry has focused on components and unique uses of tagging systems. Given the company’s R&D project team’s approach, this top cited by patent art has a pattern associated with art that would have a high risk of infringement for the project team. Uncovering this insight, the project team should request patent counsel support for its project and budget accordingly. Of particular concern is the high number of citations that the top cited by art possesses. The average citations per year rates are also quite high, indicative of an industry that is competing on the basis of intellectual property protection.
In summary, using a patent study to determine some of the strengths, weaknesses, opportunities, and threats the R&D team will face on commencing a new project is a good use of time and money. In this example study, using patent information, it was determined that upon licensing the starting patent and building an improved system based upon it would lead to the following opportunities: (1) There would likely be an opportunity to practice invention. (2) It is likely that the patented invention could be asserted against potential infringement and defended. (3) When looking at competition and what IP exists, it appears the art is potentially problematic, growing, and fragmented among many firms, not dominated by anyone. (4) It is unknown at this stage of R&D whether the patent could easily be circumvented by minor changes in reduction to practice. The R&D team should address this issue when it comes back for its next round of funding. (5) It does appear possible to enhance the IP strength prior to commercialization through additional patents.
Using Innovation Sprints to Improve Product Development
Most everyone knows about Agile sprints for software development, but they can also be applied to developing physical products. One of the most powerful approaches is an Innovation Sprint. Innovation Sprints are short (1-2 week) spurts of product ideation activity that combine the best practices of Design Thinking (customer centered innovation and prototyping) and Agile (iteration and high-performance teaming). When applied early in development, they provide a more reliable way for teams to validate that product designs will indeed delight customers. Innovation Sprints also provide clarity and space to make sure teams are working on the most creative designs. Both Design Thinking and Agile methods share the common values of customer empathy, team collaboration and rapid prototyping, though one emphasizes innovation, the other speed. Both together provide market-leading competitive advantage.
PLAN – 6 STEPS OF MISSION (SPRINT) PLANNING
- Determine the Sprint objective: (A) clear, measurable, achievable. (B) aligned to High Definition Destination (HDD), (C) drives action.
- Identify the threats: (A) obstacles to success.(B) mitigate or eliminate threats. (C) controllable and uncontrollable.
- Identify your available and required resources: (A) resources to achieve the Sprint success. (B) mitigate or eliminate threats. (C) consider resources in the following categories: training, leadership, people, clients, customers, physical resources, systems, and technologies.
- Evaluate lessons learned: (A) consider experiences of the team. (B) Experts available for consult. (C) documented lessons learned. (D) go/no go.
- Develop a course of action: (A) brainstorm and separate planning teams / TeamStorming. (B) create final course of action “who, does what, when”. (C) corporate executive team comments into final plan.
- Plan for contingencies: (A) what can go wrong, what if? (B) uncontrollable threats. (C) trigger, action steps.
B.R.I.E.F – 5 ALIGNMENT CHECKS BEFORE EXECUTION
- Big picture-brief the scenario.
- Review the mission objective.
- Identify the threats and resources.
- Execution-course of action/action steps. (A) roles and responsibilities, (B) risks and mitigation, (C) identify leaders.
- Flexibility-contingencies, stop work scenarios.
EXECUTE – 4 AREAS TO CHECK WHILE SPRINTING
- Task saturation.
- Standards, checklists, crosschecks.
- Mutual support, task shedding.
- Execution rhythm and cross-gap Meetings
DEBRIEF – S.T.E.A.L.T.H.
- Set the time: location, duration, prepare.
- Tone: nameless and rankles -events not people, not who is right, but what is right! Truth over harmony. Brutal honesty.
- Execution versus objectives: what was the Sprint objective? Was it clear, measurable, achievable and aligned with your HDD.
- Analyze execution: focus on key events: what happened? How did it happen; why did it happen?
- Lessons learned: action steps for future planning.
- Transfer lessons learned: transfer lessons learned to your team/organization. Accelerates experience. Improves future execution.
- High Note: positive summation! Celebrate road to success.
Capturing the discipline of this process into the Sprint methodology allows teams to perform at higher levels. The goal of the process is to accelerate performance through flawless execution. It doesn’t mean that the Sprint reaches its goal every time but it does mean that the processes and people involved most effectively utilized.
Role of the Project Leader
Part of successfully commercializing new business and technology development projects relies on solid project leadership. The role of a project leader is to commercialize the project objectives. This includes the ability to develop, establish, coordinate, and negotiate deliverables with customers and end-users. The project leader also needs to actively manage activities and resources assigned to the project. Further, project leader must advise the overseeing management team of the progress and next steps the project team will undertake. Finally, as part of a constant improvement process, the project leader should be expected to reduce the development time by utilizing past best-practice methods and sharing new learnings with the organization.
Most Horizon One and simple Horizon Two projects go through five phases of project management. For Stage / Gate projects and Agile / Lean projects these five steps become subsets of each Stage or Sprint. They are:
(1) Project Initiation
(2) Project Planning
(3) Project Control
(4) Change Management
(5) Project Closeout
Project Initiation Phase This Phase focuses on asking the right questions and documenting a quantitative project definition. In initiating the project, the following questions must be answered and documented. (1) Who is supposed project client? (2) Why was a project chosen? (3) Who is a project manager and why was that person chosen? (4) What does the project request really say? (5) Are the technical, business model, and new feature objectives clearly defined and reviewed? (6) What are the key questions for the project team to answer? Also in this Phase it’s important to determine whether or not the project goals are attainable. If they are not, it’s important to renegotiate the project objectives. Once the answers to these questions are clear in the project team’s mind they should be documented in a Project Definition Document and obtain management’s approval to proceed.
Project Planning Phase This Phase focuses on how to professionally answer the business and technical questions before the project. This Phase also defines the systems, procedures and organizational support that must be in place before the control phase begins. The first step in this subset is to prepare to plan. This involves setting up the project files, forming the project team, and holding a kickoff meeting. The next step is for the project team leader to work with the team to produce a work breakdown structure so everybody knows who we doing what. This is followed by preparing a schedule and budget. Some elements of this process are to determine the sequence of tasks, an estimate of the effort and duration of each, drawing up a schedule chart, and developing a budget. If the project team is been given a mandated budget they need to address how that budget will be met. In the work done so far project leader project team can determine a resource demand chart. Typically this will bring up the issue of over-commitment of resources that must be resolved. Associated with this activity is the creation of contingency plans. Once this is done the team can compare their proposed plans to the project objectives and determine if there are any gaps. If so they need to negotiate trade-offs with the overseeing management team, and once doing so complete their plans and obtain the sign offs.
Project Control Phase This Phase focuses on running experiments, collecting results, studying variances, re-planning and re-forecasting to make solid business, technical, and people decisions. To make sure everything goes as planned the project team and project team leader need to agree upon the degree of formal versus informal control that will be exerted over the project team members’ activities. Also delineated by the project team leader should be the methods for collecting actual results, how decisions will be reported, and how status reports should be prepared. As a project continues the project leader will need to analyze the variances between the plans and the actual results a project team is creating. Team leaders are also responsible for determining the impact that gaps and variances will have on the project team’s probability of successfully completing their work. If problems develop, project team leaders are responsible for pulling the appropriate people together to develop solutions, and if necessary renegotiate the project objectives.
Change Management Phase This Phase relates to how a change request is submitted to the overseeing management group. No project ever goes as planned. When changes are needed the project leader needs to initiate a change request. When this request is delegated the project leader needs to define the level of detail required to identify the sources of the need for changes, and the time, monetary and personnel resources needed to affect a change. The project leader needs to approve or disapprove change requests, bring them to the overseeing management team when appropriate, and renegotiate the project objectives if necessary
Project Closeout Phase This Phase focuses on consolidating the data, gleaning lessons learned, and archiving project information for general use. This usually means gathering up the final business and technical status of the project as well as all costs. Final status report should be prepared and discussed in a project closeout meeting that is attended by all project stakeholders. This meeting should include a segment on uncovering lessons learned by the project team in doing the project. This information should be distributed to other project leaders so they may learn as well as being appropriately archived for future use. When disseminating this information to other project leaders and easy mistake to make is to equate disseminating information with learning. Leaders often think that if they have distributed information widely, organizational members will know it. This is typically not the case unless the information is shared in a vivid manner. Thus learnings from closed-out projects are best shared in public organizational wide meeting formats.
Using “R&D Game” Insights to Set Project Parameters

In his seminal work on games of innovation Roger Miller found that value creation capture was not limited to the nature of the creative breakthroughs, but rather involved a range of activities by which products and services were developed and delivered to the marketplace. Best-practices were related to the games of innovation companies in similar business segments played. It was found that technical projects that achieved high levels of profitability and growth did so by adapting capabilities and practices to the requirements of value creation for their particular game type. The “Eleven R&D Game Types” figure shows how these game types segment according to (1) how long the technology development takes, and (2) after the technologies is developed, the time it takes to introduce that technology into the market as a new product.

The “Typical Industry Participants for the Eleven R&D Game Types” figure makes these concepts a little bit easier to understand. By looking at the industries participating in each of the game types it’s easier to envision from a technology standpoint the commonality of the industry based on the factors that affect the time to prototype and the time it takes to bring a product to market. What was insightful about Roger Miller’s work was, from an R&D project management standpoint, R&D project pitfalls could be foreseen and avoided.

As an example, various state holders influence the type of innovation that will be successful in various industry segments. There are some R&D game types that support breakthrough innovation and reward commercialization of radical new ideas handsomely, whereas other segments tend to reward incremental and next-generation research. The “Typical Project Characteristics Based Upon the Eleven R&D Game Types” figure shows the key influencers that affect the type of innovation that is best supported. Figure also shows where the innovation ideas typically come from. From a project management standpoint it’s important that project leaders and teams take advantage of these best practices and make sure that they utilize productive idea sources in the ideation phase of their project. The figure also shows typical types of funding models used for projects in each R&D game type. This too affects project success. Utilizing venture funding models is very different from allocating resources according to technology roadmaps as a percent of sales of the Corporation. Using the wrong funding model can starve a project for resources or suck up inappropriate amounts of project leader’s time worrying about the budget versus developing and commercializing new technology.

In the “Typical Project Needs Based Upon the Eleven R&D Game Types” figure other attributes associated with successful technology project management are shown. There are times when it is important have specialized personnel with technical or professional competencies integrated as part of the project team. These too vary by R&D game type is shown in the figure. Likewise a leadership style used to guide a project is important to project success. There are times when it’s most productive to have a strong individual leader such as a principal investigator with supporting lab technicians. Other times it’s important to have a more collaborative team approach were all project participants have experience-weighted voices in guiding a project. The best means to provide management oversight of projects also varies by R&D game type. Some projects require an unstructured fuzzy front end methodology where as others are better off with stage/gate or agile/lean approaches.
In summary, R&D game types are useful tools to understand which of the many best practices reported in the literature are best applied to project management within a specific company. Using the best practices taken from the wrong R&D game type slows and significantly reduces the chance of commercial success of projects.
”Stage/Gate” Project’s Gate Audit Check and Voting

The stage/ gate process as shown in the “Stage/Gate Process Steps” figure and described in chapter 12 contains project reviews that determine if and how a project continues to obtain funding and resources. Giving high-quality feedback during these review sessions is critical to make sure the project ends up with the right support. Addressing the right questions is covered in the gate review checklists of chapter 12. In addition, there are general characteristics of successful projects that the governance team needs to consider in providing feedback and direction. The governing team also needs a vehicle by which to give clear and helpful feedback. These two points are now addressed.
When managing stage gate projects it is important that the team and the overseeing management group understand important characteristics of successful projects. In particular, for Horizon Two projects done in large corporations there are seven characteristics that are important to review at each of the gate reviews. These are as follows:
Results Driven: It is the results that are being achieved that have to be evaluated. Although the way in which they are obtained is important, the means takes a backseat to obtaining commercially valuable results.
Focused on Specific Objectives: The business objectives of the projects need to be clear and well defined. When project teams reevaluate their objectives it is important that the new ones are also specific and measurable. Diffusion of objectives needs to be guarded against.
Platform Approach: When Corporation sponsored development projects are undertaken, one of the objectives needs to be development of a technology platform that can be utilized by various business units or product lines. Such leverage is critical to make expenditures of Corporate level resources productive.
Cross-Functional Teams: The project teams have both informal and formal connections. When looking at the entire network supporting project work it’s important that all stakeholder functions are represented.
Core & Advisory Groups: The size of the project team core group works best when it is small. This comes back to having very specific objectives. The teams may tap resources outside their core group to speed project work, but the actual core group needs to be small enough that excellent communications are assured. With respect to the advisory group it’s important that all stakeholder functions are represented so that nothing is missed by the project team. Note that this comment replies to the advisory group not the governing group.
Aim at High Economic Value Adding Businesses and Product Lines: During project selection, projects should have been picked with specific objectives aimed at supporting businesses and product lines with high economic value adding positions. During the project work, as product project objectives need to be reevaluated, the new objectives need to be tested to ensure the project remains focused on high economic value adding areas.
Managed Using Best Practices: Depending upon if the project is Horizon One, Two, or Three, and if it is predominantly technical or business development, will determine whether stage/gate or agile/lean management process will yield the better results. Again, as project work ebbs and flows, and objectives become reevaluated, the best management process also need to be revisited. The management practice that will ensure the best probability of success has to be utilized.
”Stage/Gate” Project’s Gate Evaluation Form

When a project comes up for a Gate review the attendees should be the project team, the advisory group, and the personnel responsible for project governance. During the gate review the gate questions are reviewed and answered by project team members. These questions were outlined in Chapter12. As the review progresses, advisory team and governance members rate the project on the anchored scales as shown in the “Gate Evaluation Form” figure. At the end of the gate review the results for each question are tallied and projected so all participants can see the results. A gate review facilitator then walks through the questions and where outlying opinions are expressed in the answers to any of the questions, the individuals responsible for providing the outlying opinions are asked to explain why they hold the beliefs they do. In this way blind spots the project team’s progress are uncovered. After this discussion the governance team members provide a consensus view on which one anchored scale answer is selected for each of the questions. The project team will take forward this consensus answer in planning their next steps. This way the project team gets both a diversity of inputs for consideration, yet specific guidance as to what to do next.
”Stage/Gate” Project’s Progress Tracking
As projects move from ideas to commercial success they do so by passing specific technical, manufacturing, sales, and marketing milestones. Passing these milestones does not necessarily happen in an orderly and timely manner. Sometimes a week or month will pass with little or no progress and other times many hurdles are passed easily.
One way for the Governing Team to see the project’s progress is to have the team map its progress as shown in the “Technology Project Tracking” figure. In this figure the elements of technical and manufacturing success expected to be passed, from the time the project starts through to its post commercial success, are put in order on the horizontal axis. On the vertical axis specific elements of sales and marketing success are also listed in increasing order. Thus technical/manufacturing activities or milestones are separated from the sales/marketing activities or milestones that are found in Stage and Gate or Lean/Agile documentation.
The project is tracked on a weekly or monthly basis by putting dots on the chart for each time increment that passes. A point is placed on the chart that represents the highest level of activity/milestone accomplishment for each axis. Lines connect each time point. Thus when things are going slowly, the dots are close together and when good progress is made the dots are further apart. This particular figure also helps the governing body determine if the team is balancing its technical progress with its business progress. The dots so connected create a unique innovation pathway for each project.

Projects creating an innovation pathway going more or less up the 45 degree line are on-track. Projects going up just one axis are unbalanced. Usually this happens when the project team is unbalanced with either technical our marketing personnel skills. In this case they play to their strengths and make good progress, but only in one area. The “Technology Project That is Off-Track” figure illustrates such a case. This example project is headed towards technical success but there are no customers being signed up to buy the new product! Such cases need advisory or governance team intervention and/or support, or should be killed.
”Stage/Gate” Project’s Progress Tracking Example
The “Project Tracking Example – Manufacturing Tool Development” figure provides an example of what a real project looks like. It is being tracked monthly. Each point where the curve jogs is a monthly review point. This particular project started out with strong accomplishment of sales and marketing objectives followed by a period were technical progress was made. In the second most recent month of the project, progress was made on both fronts. In this example case the project tracking figure allowed the advisory and governing teams to quickly assess project strengths and weaknesses, and provide advice to the project leaders in a timely manner in a way that kept the project on track and balanced.
A similar situation happened for a technology project working on molecular modeling software that would speed all product development efforts. In this case the customers were R&D scientific personnel. As the “Project Tracking Example – Molecular Modeling Software Development” figure shows this particular project had a series of technical successes, but did not share or market their results to the rest of the organization. This was uncovered at one of the gate reviews. The team was told to halt its technical efforts until it could demonstrate that the organization’s personnel, as customers, would use the software once it was fully developed. The team successfully made this correction as shown in the strong vertical line in the center of the figure. After that the project team went on to better balance its technical and marketing efforts to ensure that the software both met the technical objectives and at the same time its use was embraced by the R&D organization as a whole.
Snakes and Ladders Approach to ”Stage/Gate” Project’s Progress Tracking
Another approach to tracking projects is to use a linear sequence of steps that takes into account however the barriers and enablers associated with Project surprises. First a game board is constructed as shown in the “Snakes and Ladders Approach to Tracking Service Projects” figure. This is especially useful for projects which are aimed at creating new advanced service offerings. In this example the 49 steps of the process have been laid out in a linear manner as a game board. Overlaid on the game board are ladders which allow projects to advance under special conditions. Also shown are the common pitfalls and barriers (snakes) that projects may experience, and the resulting impact. Project teams plot their progress as tokens along the pathway. Laid out in this manner, this tool reminds project leaders and management of common opportunities and pitfalls ahead.
Funnel Map Technique for ”Stage/Gate” Project’s Progress Tracking
When looking at a portfolio of projects another useful project tracking tool is shown in the “Funnel Map Technique for Tracking Projects” figure. In this figure projects are placed on Post-It notes in hardcopy, or text boxes in softcopy, according to the Stage the project is in. The vertical dimension is the number of months or quarters the project has been in that stage. The project leaders are responsible for updating the chart monthly. This emphasizes to them the progress they are making relative to others, as serves as a quiet motivator. For management it shows what projects are slowing down in their progress and can use additional support and/or guidance. If the project “tracks” over time are added as yarn strings or graphic lines, they can be used by process improvement personnel to see visually the variability in project advancement through the stages.

In the “Example Funnel Map of Projects” figure a Corporation’s active R&D projects are shown as an example. One can see at a glance the number of projects that are in each stage of the pipeline, as well as a time each project is taking in a particular stage. From the example it can be seen that the number of projects being pruned from the portfolio along the pipeline is very slight. Effective Stage and Gate processes typically have a much higher attrition rate in early stages. One can also see that for this particular organization it’s taking approximately 6 months for each stage. Again for well-managed Stage and Gate processes the early stages should have much lower cycle times than the latter ones unless the organization is good at adding additional resources to later stage projects to keep their cycle times short.
Corporate Innovation Needs Map for ”Stage/Gate” Project’s Progress Tracking

The above techniques for tracking projects progress are quite useful for the project team. Its use however is focused on providing feedback to one specific team. However the tool also has a use when collected and viewed as a portfolio of progress. This is especially true when the Horizon One, Two and Three projects are viewed as three clustered groups. To see how this clustering can help the “Technology Portfolio Drivers” figure, taken from the strategic planning section of this compendium, shows how the Corporation sales are projected to evolve over time as a function of the introduction timeline of each category. Recalling from the earlier discussion in this compendium, the top line sales each year are determined by analyst expectations of what revenues are required each year to sustain their “buy-the-stock” recommendations (which drive stock price growth and management bonus/options).
Technology and business development projects designed to meet Blue and Brown lines are derived, and clustered together, from operating plans and budgets. Projects being undertaken to meet the Red line are derived from strategic business / technology development plans as supported by written capital plans. Projects to meet Green line are derived from funded strategic business / technology development plans.
A convenient way to display all the information discussed in this section is to utilize one wall of a Strategic Planning War Room. A schematic of what this one wall of the War Room Displays looks like is shown in the “Technology Project Portfolio Tracking” figure. The Technology Project Portfolio Drivers figure is used in the upper left as a reference point that is updated over time and analyst expectations, to show what will be needed. Projects clustered by the three time horizons are put in three horizontal rows. The left to right position of projects in each cluster is determined by how close the project is to completion. Those with green borders represent the projects that the governing team is currently counting on to meet the expected gaps shown in the technology portfolio tracking figure.
Note that not every project is surrounded by a green box. This is because not every project is expected to succeed. Thus the Green Boxes show how many successful projects of the total underway will be needed to meet the needed target revenue gap (success rate). This provides the Corporation’s top management and the strategic planning teams the insight they need to start and nurture enough high-quality programs to sustain corporate success.
Holding quarterly executive management reviews in the strategic planning war room is a productive and vivid way to plan, nurture, and audit new business and technology development contributions’ to corporate success.
Project and Program Management Tracking Tools
As innovation funnels grow in size and/or complexity to achieve corporate growth ambitions, program management teams must become more efficient with their time and finite resources. Therefore, emerging systems & tools in the area of project and program management are important to utilize. In the Spring of 2018 the IRI did a survey of the tools in use at that time. Unfortunately most respondents said they were using various systems, but that none of the tools really allowed their organizations to reduce the time spent in recurring project review meetings. Nonetheless, the tools in use were:
1. What new or existing Program Management tools and approaches that you have found to be exceptionally valuable in your organization?
- Microsoft OneNote
- Managing timelines in Excel
- QlikView for displaying data
- MS Project and Agile Product Development.
- Accolade
- Total project overview database
- We have a customized version of a commercial Project Management software that we use for portfolio reporting and program management.
- Our Lean Six Sigma department uses a platform called PowerSteering for program management of these projects.
2. Are there tools that you use to better automate innovation/product development activity workflows and communicate next steps in the project plan?
- Microsoft OneNote
- SmartSheets, ServiceNow, etc.
- Clarizen which is enhancing the Program part of their tool.
- MS Server
- MS Office Suite
- Accolade, MWS, smartsheet
- We have fairly limited workflow automation features that are embedded into our customized data tracking system for stage-gate projects
- There is more sophisticated workflow that is embedded into Sales Force.com and utilized for single-customer sales opportunities that require technology resources to specify the product design.
Appendix I. Detailed Horizon 1 Project Management Process


Sources, References and Selected Bibliographic Information
1. “The Corporate Startup”, by Tendayi Viki, Dan Toma, and Esther Gons, Vakmedianet, 2017
2. “Opportunity Enhancement”, by Office of Innovation, Hoechst Celanese Corporation, 1996
3. “Is my invention patentable? A video case study on how to do a simple patentability search.” by Mike Lloyd of Ambercite, White Paper, January 2018.
4. “The Five Phases of the Project Management Process” by Project Management Mentors, White Paper, Aug 1994.
5. “Value Creation and Games of Innovation” by Roger Miller and Serghei Floricel, research technology management, Nov-Dec 2004
6. “It’s all in the game” by Paul Germeraad, Intellectual Asset Management, Jan-Feb 2010.
7. “What program management tools do you use?’ by IRI Forum, This week’s Community Forum Survey Results, Innovation Research Interchange, April 27, 2018.
8. “The one-page project manager”, by Clark Campbell, Wiley, 2007.
9. “How to successfully keep R&D projects on track!”, by Robert Szakonyi, Lomond, 1988.
10. “Managing Technology”, by Lowell Steele, McGraw Hill, 1989.
11. “Inside the Tornado”, by Geoffrey Moore, Harper Business, 1995.
12. “Product Creation”, by Philip Francis, Free Press, 2000.
13. “Managing Innovation”, by Joe Tidd, John Bessant, and Keith Pavitt, Wiley, 1997.
14. “Technology Management”, by Robert Szakonyi editor, Auerbach Publications, 1992.
15. “The Art of Project Management”, by Rich Mironov, Enthoisys Press, 2002.
16. “Crossing the Chasm”, by Geoffrey Moore, Harper Business, 1991.
17. “Success Factors in NPD”, by Robert Cooper, Wiley, 2009.
18. “How to Prioritize Your Project Portfolio”, by Luke Hohmann, Conteneo Press, 2014.
19. “Accelerating performance through flawless execution”, Pamphlet by Afterburner, http://www.afterburner.com, 2013.
You must be logged in to post a comment.