
Strategic Business Planning
- Overview of factors Affecting Business Strategic Plans
- Strategic Plans vs. Strategic Architecture
- Strategic Planning for Incremental Growth
- Strategic Planning for Disruptive Growth
- Matching Asset Planning to Industry Segment
- What Stakeholders Expect In Business Strategic Plans – Boards and VC’s
- Sources, References and Selected Bibliographic Information
————————————————————————-
Overview of factors Affecting Business Strategic Plans
In the next chapters we’re going to address strategic planning from a number of viewpoints. The first chapter in this series relates to business strategic planning.

Shona Browning and Kathleen Eisenhardt compared various ways to create business strategy. They came up with the observations shown in the “Four Models of Strategy” figure. The first three methods are tried-and-true so they will be discussed further below. For the Competing-on-the-Edge model, Shona and kathleen’s viewpoint was that competing-on-the-edge provided a competitive strategic advantage because it is unpredictable and based upon surprise. It’s also an advantaged approach because it is uncontrolled. It is not about command and precision planning by senior executives. It’s about strategic planning centered at the business unit, not a corporate headquarters. It’s also not about efficiency. It’s about trying things, failing and learning from them. It’s not about planning once and hoping to get it right and not changing your mind. It also has the advantages of being proactive, continuous, and diverse by involving many people from all parts of the organization and at all levels of management to participate. In short this approach was the predecessor to Agile approaches.
From a process standpoint the competing-on-the-edge approach to strategic business planning is managed to be just at the edge of chaos. It has very little structure, plans are developed just in time and consistent with industry trends and the pace of competitive offerings, as well as the rhythm of product extinctions and substitutions within your own firm. If done right the result is a continuous flow of competitive advantages from a continuous series of business strategies.
The above notwithstanding, oftentimes business strategic plans turn out to be a waste of an organization’s time and effort. Many experienced operations managers look at strategic planning with an appropriately jaundiced eye. The best way to circumvent this viewpoint is to put together strategic plans just as you would a good sales call.
In basic sales training the sales process is often outlined in six steps as exemplified by the following: (1) people need a reason to change. (2) people buy from people. (3) the product or strategic plan is in the mind of the buyer. (4) people make emotional buying decisions for logical reasons. (5) the correct use of power during the strategic planning process is key. (6) you can’t sell to someone who can’t buy. Many strategic planning cycles do not meet the basic sales selling criteria. When these guidelines are not followed, strategic plans are put together and then put on the shelf, never to see the light of day. In contrast, meeting these six criteria is a good way to ensure business strategic plans provide organization’s real guidance.
The first element when putting together a strategic plan is to remember that people need a reason to change. People involved strategic planning typically work in one of four “interest” environments: (a) The first environment is when business results are the same as what is in the strategic plan and operating plans put forward. In this case there’s very little tension with an organization and so a strategic plan may be nice but not necessary for success. As a result planning in such environments is usually not productive. (b) The second environment is when a company is in trouble and people hope for steady growth or improvement in what they’re experiencing. For example when there is a large downturn, there is interest in a plan, but too often it’s not a strategic plan but rather an operating or fix-a-crisis plan. Here again it’s often difficult to get a management team’s appropriate attention. (c) The third environment is when improvements are desired that are in excess of existing solid business performance. This is the best type of an environment in which to do business strategic planning. (d) The last category is one in which the management team is overconfident and asks for results greatly exceeding any that employees view as remotely realistic. In this case people very often create a strategic plan that is fiction and not implementable.
In summary, before putting together a strategic plan it is imported to step back and look at the kind of environment in which a management team is immersed in. Looking critically at this environment can forecast whether or not strategic planning is really going to end up being a true value-added activity or not. If not, it’s often better to put together appropriate functional strategic plans, i.e. technical, intellectual property, human resources, operations, etc. and leaving an integrated plan open.
The second element to think about before jumping into business strategic planning is to remember that people buy from people. It’s about the relationship and rapport between the individuals putting together the strategic plan and top management. If senior management does not value and trust the insight and wisdom of the individuals putting a plan together, a plan is likely to be met with skepticism and not implemented rapidly. It goes without saying that having senior individuals as part of the planning team are critical to its success at being adopted.
The third element to remember is that a strategic plan really has to be put together in a way that it matches what a “strategic plan” is in the mind of the senior management team. You really need a “vision match” between the strategic plan that’s being developed and the capabilities needed to solve the company’s problems and set the stage for growth. A good strategic plan absolutely incorporates senior management’s vision or viewpoint of what the company’s world is going to be like after the planning process is complete. As a note of caution, be careful when senior management team members transfer in and out of an organization. When they do, the expectations of what a strategic plan is may change.
The fourth element is that people make emotional buying decisions for logical reasons. The logical basis most frequently used to justify investment in new business development is growth in revenues and profits. When the outcome of a plan is a foregone conclusion to support a senior manager’s emotional needs, many times it is waste of time to go to the trouble to put together a plan. To do so is simply a waste of business resources.
The next element is to remember that the correct use of power is key. Drawing many individuals into the strategic planning process when the return is likely to be modest, can be met with criticism. It’s always wise to remember that B+ is good enough, that the 80/20 rule is alive and well, and that a little bit wisdom goes a long way. Since many of the assumptions that go into strategic planning are what drive the ultimate outcome, it’s important to remember that the amount of work required to develop a plan’s assumptions should be consistent with the certainty that the plan is going to inherently possess when it’s completed. Far too often planning assumptions that are deeply researched mixed with others that are top-of-the-head assumptions. A strategic plan is only as good as its weakest assumption. Spending money to create just a few strong links doesn’t make a good plan.
The last element when selling strategic planning is that you can’t sell to someone who can’t buy. This means getting access to someone senior enough in an organization to carry the plan out. A good plan needs somebody who can “sign the check” and is emotionally invested in its outcome. The latter requires creating a vision and a compelling reason to change. Therefore strategic plans need to go together in a way that management can see. Plans need to be actionable and implementable.
For the business plan itself, in his seminal work on business strategy (“Competitive Advantage”), Michael Porter lists a number of generic competitive business strategies. They were cost leadership, differentiation, focus, and stuck in the middle. As a way to understand competitive advantage, Porter describes how competitive advantage can come from carefully defining the value chain surrounding a product. He advocates various competitive strategies based on the vertical linkages up-and-down the value chain from your position, the value chain product scope, the value chain geographic scope, the industry scope and coalitions. Porter also advocates that cost can be a business strategy, but to really succeed you have to have a good understanding of the relevant costs competitors’ products and a means by which you can gain a superior sustainable cost advantage. Differentiation is a business strategy that typically brings the biggest return, especially when it’s coupled with a technological change that affects the value offered to customers.
Of note is that each generic strategy employs different skills and requirements for success. Which commonly translates into differences in organizational structure and culture cost leadership implies tight control systems, overhead minimization, pursuit of scale economies, and dedication to the learning curve. The same competencies and cultural aspects could be counterproductive to a firm attempting to differentiate itself through constant stream of creative new products.

The advantage large multi divisional corporations have over smaller ones is the opportunity to leverage resources. With respect to how multiple products from a single corporation can benefit multiple divisions, the “Possible Sources of Interrelationships” figure shows how advantaged positions can been be established. Note that although this is with respect to several divisions in the same Corporation cooperating, it could equally be true for companies that establish similar relationships with external partners or service providers.
So how can leaders translate the complexity of strategy into guidelines that are simple and flexible enough to execute? Rather than trying to boil the strategy down to a pithy statement, it’s typically better to develop a small set of priorities that everyone gets behind to produce results. This observation comes from the fact that a series of strategy experts have argued that managers should distill their strategy to a concise statement (less than 35 words) summarizing a few core choices. The strategy distillation approach hinges on a few fundamental strategic categories — such as the choice of target customer or core competencies — that can summarize the heart of any company’s strategy. However, that this approach only works best with companies that have relatively straightforward strategies to begin with. Simple strategies don’t work for companies that compete in multiple businesses, serve multiple customers, or are in the midst of a strategic transition.
Instead of trying to summarize their strategy in a pithy statement, managers should translate it into a handful of actions the company must take to execute that strategy over the medium term. Strategic priorities should be forward-looking and action-oriented and should focus attention on the handful of choices that matter most to the organization’s success over the next few years.

Many executives report that they use strategic priorities but say that the approach isn’t working as well as they had hoped. To set the strategic agenda and drive implementation effectively, it has been found that strategic priorities need to balance guidance with flexibility, counterbalance the inertia of business as usual, and unify disparate parts of the business. Crafting strategic priorities that do all of these things — and do them well — is a tall order. The “Seven Characteristics of Effective Strategic Priorities” figure, can help managers set better objectives.

Most of the characteristics are self-evident. A few comments however are worth making. First, the number of priorities should be between 3-5. Second, strategic priorities must provide concrete guidance to the troops. American Airlines five imperatives for 2014 were so vague that they could’ve applied to any industry. By contrast, Southwest Airline strategic initiatives were concrete enough to provide action and investments. This is shown in the “Vague Versus Concrete Strategic Priorities” figure. Third, executives rightly focus on how to craft a great strategy, but often pay less attention to how their strategy can be implemented throughout a complex organization. To steer activity in the right direction, strategy should be translated into a handful of guardrails that provide a threshold level of guidance while leaving scope for adaptation as circumstances change.
A final comment on business strategy is from by Robert Burgelman’s analysis of Intel Corporation. In that book he contrasts strategy versus destiny. Destiny is an archaic idea of a fixed and inevitable future. Strategy, in contrast, is a modern idea, of an open-ended future to be determined by it. In reality the two ideas exist in perpetual tension. Successful and unsuccessful strategies shape a company’s destiny. But if the strategy shapes destiny, destiny has ways of asserting itself in constraining strategy. New sources of strategy create the possibility of future destiny, and help the company evolve. Strategy is a means to gain and maintain control of a company’s present and future destiny, and successful strategic planning efforts are ones that impact destiny.
Strategic Plans vs. Strategic Architecture
There are many strategic planning consultants, each having their own model for how to best use strategic planning. Each of these planning methodologies has similarities and the differences. Those differences usually relate to the industry segments of the businesses and the company’s position as either that of a market leader or a new entrant. Remembering that this book is focused on innovation management, the types of business strategic planning that we’re talking about here is for companies where business growth is critical to success.

Traditional strategic planning is shown in “Contrasting Strategic Planning Methods” figure. This graphic contrasts traditional strategic planning with that of the seven “S” methodology which is focused on creating a strategic architecture for a corporation. Examining these two models, it is seen that the vision and mission are fully explored in the strategic architecture framework. As in the traditional strategic planning framework, the strategic architecture framework loos at leadership, culture and values, structural systems, and core competencies. Additionally, in the strategic architecture model one also thinks about (1) the quality of the intellectual leadership of the corporation (which we will discuss later in our human resources section), (2) the management of the migration path between what is today and the future, and finally (3) competition for market share.

A more detailed distinction between strategic planning and strategic architecture is provided by Hamel and Prahalad as shown in the “Strategy as Patient Money” figure. Although more detailed, the key differences between the two is that crafting a strategic architecture requires utilizing a much more expansive view of industry, technology, customers, and corporate staff.
Consulting companies have variants on these two approaches. They all involve thinking about a very high-level vision and mission which can include the intellectual capabilities that really identifies the potential of the corporation. This is often expressed as a unique point of view. As was seen in the previous sections on mission, vision, and values these can also incorporate a behavioral agenda. Almost all consulting entities’ work focuses on making new values and behaviors tangible. Some strategic plans also have a skills agenda which really is about building the core competency and leveraging capabilities. Others put this into the visions and strategy framework. Likewise there is usually an administrative strategy to provide the infrastructure to achieve the products and services that the company hopes to build. The strategy also oftentimes involves incrementally improving the core administrative processes.

Being pragmatic, the “Project Selection Criteria vs. Business Needs” figure shows how large companies go about developing a strategic plan once the core mission, vision, values, core competencies, and strategic intent have been defined. this process usually starts at the senior executive level. One knows the current market capitalization of the company from the shares outstanding and the stock price. From stock market analyst expectations the expected stock price over years to come can be derived. Assuming that the overall corporate returns will be at the same return on sales as today, one can calculate from the analyst expectations the revenues required per year over the next decade. This would be the uppermost line of the graph embedded in the “Project Selection Criteria vs. Business Needs” figure.
Analysis of this graphic allows the senior management team to look at the upper line of revenues over years (according to what the analysts are expecting) and compare that viewpoint to their own internal viewpoint, and see whether those expectations are going to be met or not. It is no surprise that analysts’ expectations usually exceed what a company can reasonably expect to obtain. Large companies then look at the operating strategic plans of the existing business units. These plans are the ones shown in green box and in the lower triangle of the graph. This organic sustaining, incremental, or Horizon one work (depending on industry jargon), can be predicted with a high degree of certainty. Growth that comes from initiatives such as new products, services, geographic expansion, management changes, and operational improvements causes the green shaded area to increase over time. The result of such efforts usually fills in the gap, making the “miss” to analysts’ expectations smaller.
However, this often still leaves a significant amount of revenue growth yet unaccounted for, particularly in the out-years. The next step for senior management team is to then look at how one can fill the remaining gap with next-generation, Horizon 2, or translational and transforming new products and services. This growth is often forecast by new business development groups, long-range R& D groups, venture groups and specified corporate initiatives. This work is shown by the blue box and blue shaded area in the Figure. What typically happens is again the gap has narrowed. But as we see in the “Project Selection Criteria vs. Business Needs” figure there is unfortunately still a small gap yet to be filled.
The last gap is in the Figure is usually assigned to a breakthrough, Horizon 3, scope-change or step-out business development or venture group work.
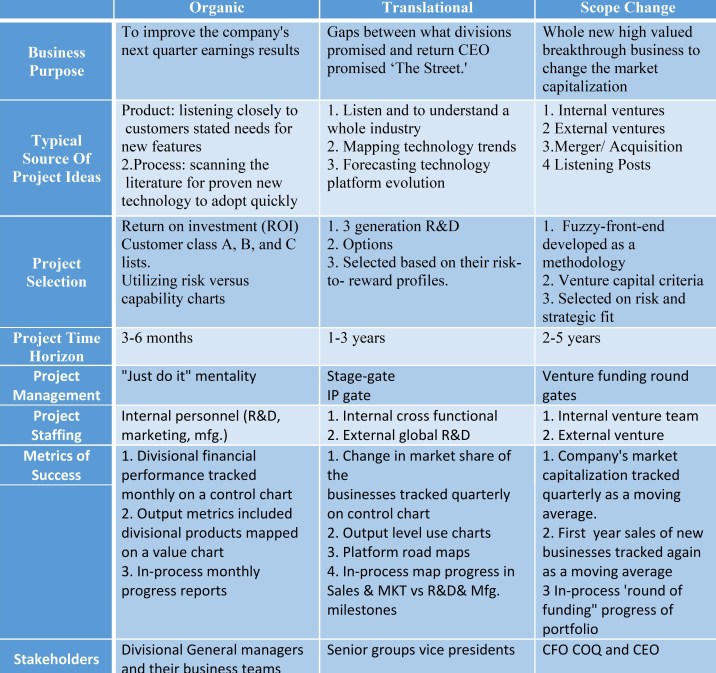
Planning in this manner is extremely helpful for those involved in innovation management. Looking at the business needs according to what is required to meet analyst expectations sets the stage for purposeful strategic planning. The reason these three time horizons helps so much in strategic planning is shown in the “Project Selection Characteristics” figures.
These tables show how the organic sustaining work is really focused on improving the company’s next quarter’s earnings and results. The translational or transforming work really allows the CEO to deliver performance consistent with analysts’ expectations over a 3-5 year time horizon. The final scope changing work provides highly valued breakthrough businesses that will really change the market capitalization of the corporation in the many years to come. These Figures show the typical source of project ideas for each of these three areas, the project selection criteria, the projects’ likely time horizon, project management methods, project staffing quantity and type, and the projects’ measurement of success.
Knowing that strategic planning from an innovation management standpoint can be broken up into these three broad categories allows one to use the appropriate strategic planning methodology for each of these three areas. Many times this distinction is not made clear to a management team and a single methodology is used to solve both the need for a grant organic translational and scope changing growth. This results in a strategic plan that is unfocused and unlikely to yield optimal results.
Strategic Planning for Incremental Growth


The most critical component of incremental business strategy is to understand customer’s needs. In the “Learning Customers’ Needs” figure the common forms of gathering needs are shown. In contrast to this list are the “Needs of Potential Customers” shown in the following figure. Note that in-person interactions at trade shows jump the top of the list when looking for new business. That said, looking at the form of discussions with customers most companies focus heavily on current customers’ problem areas as shown in the “Discussion Points” and “Customer Development Process” figures. The critical importance here is that the relative effectiveness of these approaches with respect to long-term success is poor as shown in the “Relative Effectiveness” Figure. Thus it is critical to utilize processes outside of customer engagement if good next-generation or breakthrough strategic direction is desired. But for incremental strategic direction is desired, the next step is to prioritize what is heard from different customers.
The best way to prioritize what direction a strategic plan for incremental growth takes is rank order a customer list by those that usually have the highest volume or highest profitability for a corporation. The problem comes when customers low on the list ask for an increase in the product line items to meet their needs. An important distinction to make is to understand that these customers make two types of requests. The first type is when the request reflects a true market need. Helping these customers service their needs builds growth for everybody. The other type of request comes from a customer that has misjudged their customer’s true need. Servicing a customer request for such a misguided a new feature creates more product line items with limited volume and profitability.
These concepts came to light in the late 1980s and early 1990s when reengineering efforts throughout corporations became prevalent. The work was made more popular in the early 2000’s with a book, Angel Customers & Demon Customers, written by Larry Selden and Geoffrey Colvin. The “Economic Profit per Customer Example” figure shows the distribution of wealth that the good and bad customers create for corporations. They used a form of EVA (economic value added) to assess each customer’s contribution, that is a spread (or return) on invested capital minus the cost of capital.


Important in the “Differences in Shareholder Return Between Companies” figure is to note that it is a normal distribution pattern that is typical of many companies’ customers. Another way to look at the same data as shown in the “Economic Profit per Customer Example” figure. Here the ETA per customer is shown and the normal distribution now shows us the positive and negative EVA being contributed by each decile of customers.

Diving still further into the EVA per customer, the “Customer Segmentation Matrix” figure shows that for any customer there are product lines that are profitable and those that are not. When customers request unique and distinctive features in a product one drifts away from the sweet spot of this graph into unprofitable areas.
From an innovation management standpoint a company will have many ideas from customers. The way to go about strategic planning in the incremental area is to quickly put customer requests on a chart which shows the contribution by customer by product line. One can quickly determine which are going to generate profits for a company and which ones should be sent back to the salesperson declining the opportunity. This is hard to do, but good methods are described by Larry and Geoffrey in their book on ways to deal with customers appropriately. From an innovation management standpoint and business planning it’s a matter of taking the top 20% of the needs described by “A” list customers, focusing on those with a “just do it” attitude and discard the rest pending a review by the sales organization.


The “Factor and Sub-Factor Ratings for New Product Strategies” figure provides many of the relevant considerations for screening of new product strategies. This is one of three often used screening tools. The other two are Breakeven Analysis and Preliminary Financial Return Analysis. The one illustrated in the figure is a Product Profile Analysis conducted by knowledgeable managers and experts. When scores between competing strategies vary widely this provides a quick assessment of which strategy to choose. When the numerical scores are close however, in-person discussion and deliberation among the experts is necessary.

Before moving on from the segmentation matrix of the “Customer Segmentation Matrix” figure, notice that there is a box for high profitability where the homogeneity of the need is low. Ideas in this box represent excellent business opportunities requiring further review. Looking at organic or incremental growth in this box, as well as perhaps a little and translational or next-generation growth is the specialty of long-established industry specific consulting firms. Strategic planning for growth in this box is usually done by segmenting according to the elements of a business model. Often they involve six typical steps. These relate to the value chain, business segmentation, business scope, technology, competitive advantages, and value proposition. These are shown in the “Elements of a Business Model” figure.

In “Jump Start Your Business Brain: Win More, Lose Less, and Make More Money” Doug Hall describes the way to look at business strategies in simple terms. He focuses on three drivers. They are the “Overt Benefit”, the “Reason to Believe”, and the “Distinctive Difference” of one company to another, as shown in the “The Laws of Marketing Physics” figure. When setting business strategy, these elements of your company’s business model need very careful consideration. Contrasting the “Customer Segmentation Matrix” figure with the “The Laws of Marketing Physics” figure, Doug’s Overt Benefit is hidden in elements 1 and 3, the Reason To Believe in elements 2 and 4, and the Distinctive Difference is in elements 5 and 6.
Understanding a company through these perspectives enables creation of business strategic plans for incremental and some next-generation growth. The purpose of each element in the Business Plan follows (in outline form):
Define all key elements of the business including:
- How value is delivered to its customer base.
- Sources of competitive advantage to be built or sustained.
- The product or service bundle and how it will vary by customer segment.
- The role of technology in value creation and resourcing levels.
- The overall scope of the business — the value chain position.
- The drivers of business value and overall economics.
Key elements of the model should include:
- Value chain positioning.
- Business scope (products and services).
- Technology position.
- Customer and market segmentation.
- Business value drivers and Company’s competitive position.
- Customer value proposition.

Getting a little bit more specific the “Example of a Business Model for Surfactants Industry” figure shows the examples of a business model for a company in the surfactants industry. This picture is laid out along a value chain of raw materials, intermediates, surfactants, and end users and customers. It answers the questions of what are typical products, the size of the market, the market’s growth rate, the concentration of industry players, value drivers, the typical margins, and where specific companies are working along the value chain.
In the example shown, the typical margins along the value chain are relatively equal, although one can see that the intermediates market and the end-use consumer portions of the value chain are generating much higher returns than for instance those parts of the chain dealing with the surfactants themselves. One can also see at a glance which companies are participating in the high-growth areas and to some insight what the value drivers might be that a company would have to take advantage of when innovating new products and services in order to take share in these portions of the value chain. It is again worth reiterating that this planning methodology works best in established industries were market size, growth rates, participants and margins are known.

Stepping back a moment and looking at this Chapter’s contents, from a business strategic planning standpoint we are making progress, but we are still not to the point of understanding what our strategy should be. Oftentimes the next step is to segment the industry in a particular manner to look where leverage exists. This is exemplified in the “Segmenting an Industry to Look for Where the Leverage Is” figure.
In this representation we see that it’s important to consider segmenting the market along the products and services offered, the markets and applications that are served, type of customers, and the geographic region in the world to focus on. Notice that the table is a matrix so that the markets, customers, and competitors show up as columns as well. This forces us to think about how the product variability changes as a function of market, customers, and competitors. It also highlights show how markets and applications vary by customers and competitors, and finally how geography affects markets, customers, and competition. Filling in this table allows us to determine where the sweet spot might be. It covers segments that have the largest size and growth rates and within those segments, the market, customer, or competitors that we should focus our business strategy on to gain maximum leverage.

The “Example of Segmentation by Markets” figure shows for the different business segments the sales, growth rate and most importantly the descriptors. It gives us a sense for which segments are the ones that are likely to be the most profitable and subject to our application of strategic resources.

Taken from this picture we see in the “Example of Value Propositions That Will Drive Business Strategy” figure an example of value propositions that are going to be able to drive our business strategy. In this listing is a column titled nature of the value proposition. It is in fact the attributes that we’re going to use for driving innovation in specific areas. Another good column to add (not shown), is one that addresses Doug Hall’s Overt Benefit, Real Reason to Believe, and Distinctive Difference.
Solid innovation management in areas where incremental and some next-generation growth is needed is best done by a very clear understanding of the value proposition. Targeting innovation appropriately to take head-on the value proposition in a way that attracts customers away from competition is key to success. It also lays the groundwork for our intellectual property strategy because it outlines the nature of the claims that we wish to achieve when our innovation efforts are successful. As we’ll see later in the innovation strategy area it’s not enough to claim how you do it but one that also claims intellectual property around the “choke point” or value proposition description. Understanding this concept at the outset is key to productive integration of business strategy with intellectual property management.
Remembering that we’re focused on incremental innovation for known markets allows us to utilize market research that is readily available. The “Services Example of Business Scope Where Further Segmentation Shows Areas of Most Value” figure shows there are four service offerings placed in a hierarchy.

These service offerings range from low value services up through to the ultimate selling of a customer on a solution. Because of the incremental nature of the new product or service to be created, the future costs and the revenues can be relatively reliably forecast when innovating along this hierarchy. Again it’s important to remember that for incremental innovation the selection criteria for which project to do is going to be done on an ROI or customer class priority listing. Projects with the lowest risks and the highest organizational capability to deliver are the ones that are going to be selected by such a selection strategy. Thus, understanding completely the elements of cost incurred and returns received from incremental innovation isn’t as critical as for next-generation projects.
When strategies are put together in the manner of the “Services Example of Business Scope Where Further Segmentation Shows Areas of Most Value” figure it is easy to see which of the four types of innovation might be best employed to deliver value to a corporation. It could be the first type of innovation that is product or service innovation involving a physical product or service or enhancement. Alternatively the second type of innovation involving a process for improving efficiency or effectiveness might be appropriate. The third kind of innovation which involves a new marketing concept or action can be determined from such segmentation matrices. Lastly, and sometimes overlooked, is a management innovation, the fourth type. This innovation talks about a new way of managing or constructing a completely different business model. It was the dot-com boom of the late 1990s that showed this type of innovation could lead to very high investor returns. Specific forms of differentiation are:
- Differentiate products using unique features.
- Differentiate products based on increased customer benefits.
- Differentiate products based on improved productivity.
- Differentiate products based on protecting the customers’ investment.
- Differentiate products by lowering the cost of product failure.
- Differentiate products with high performance.
- Differentiate products based on unique fundamental capabilities.
- Differentiate products through design.
- Differentiate products as total solutions.
- Differentiate products based on total cost of ownership to the customer.
- Differentiate products based on brand-name or service.
William Hall and Michael Porter studied carefully such business level strategies. Their research showed that strategies at the business level can often times be reduced to a two-dimensional figure. This is shown in the “Survival Strategies in a Hostile Environment” figure.

This figure is a variation of the standard relative cost versus relative performance graph used in the 1970s and 1980s by Bain consulting firm. The distinction is on the vertical axis one looks at relative differentiation as the element of segmentation, versus relative performance as done earlier. In either matrix it is high relative differentiation or higher relative performance at low relative delivered cost that generates all the value. The converse of low differentiation and high costs “the valley of death” is unfortunately where some innovation projects get funded. In the book “Innovate or Evaporate” by James M. Higgins, the product innovation strategies associated with various well-known companies are positioned on this matrix. He has talks about product innovation at three levels. The first level being kaizen or continuous improvement. The second level is what he calls leaping or what I call next-generation new product development. And finally the third level of innovation Higgins calls Big Bang innovation (equivalent to Breakthrough or Horizon 3).

From a business strategy standpoint it’s important to know where a project is placed on this graph as well as on the more traditional graphic developed by Bain Corporation as shown in “Value Map” figure. It is this graph which does the best job of showing integrated business, technical and intellectual property management.
If one is conducting innovation at the upper left-hand quadrant of the graph one wants to protect the technical innovation with every form of intellectual property possible. If one is operating as a corporation in the upper right quadrant one wants to protect those new products with intellectual property, but judiciously thinking about in which countries of the world should IP be obtained to best thwart competition. Also, for a corporation operating in the upper right quadrant a new product or technology located in the lower left quadrant should not be resourced but if it is created within the company, hopefully by accident, would be put out for licensing. That is because it would be incongruent with the company’s ability to market, sell and distribute such products. A business ROI would best be gained by licensing to competitions who were branded and known for working in that lower left area of the market. Historically companies well known for working in the upper right hand quadrant were Hewlett-Packard, Intel, and 3M. Historically companies known for working in the lower left quadrant are companies like Wal-Mart and Hyundai.

In order to get a sense of how fast dots (products) will migrate across the “Value Map” figure, experience curves can be created which represent the cost per unit as a function of the total accumulated volume or units. This is shown is the “Example Experience Curve” figure. This log-log linear relationship has been found to be generally applicable across almost all industries. Note that although time increases with experience, the curve is plotted against units produced and may be quite irregular with respect to time. That said, the rate of migration across the value map can be estimated and used for strategic planning purposes. The rate of migration for performance on the y-axis is much more irregular and not as easily ascertained for planning purposes.


In a large Corporation there is always the question as to which business units should receive the bulk of the corporation’s innovation resources’ attention. To answer this question two financial measures of divisional performance are helpful. These are the Economic Value Added (EVA) of Divisions in a Large Corporation and the Cash Flow Internal Rate of Return (CFIRR) of Divisions in a Large Corporation. Both are shown in the respective figures. For business strategic planning, offensive next-generation innovation should be applied to those divisions with a high EVA and high CFIRR. Incremental customer focused innovation can be applied to those divisions in the upper half of the EVA spectrum and who have an adequate return above the real cost of capital. For those divisions that do not meet this threshold and have inadequate or negative returns the only option from a strategic standpoint is to invest in radical or breakthrough business models or technical innovation if the underlying marketplace trends warrant such an effort. This is not often the case and thus innovation resources should be withheld from such divisions. From a business strategy standpoint sale of such divisions to a competitor, or acquisition of a start-up company with a breakthrough business model are two acceptable strategies.

For incremental business strategies, several other generic forms are available. These include price-based strategies (either offense or defensive), time-based product strategies (based on superior product development process cycle times), product family strategies (“Patterns of Product-Model Evolution” figure), global product strategies (by leveraging a regional product into new regions or develop customized global products by region, i.e. Flavored beverages) and cannibalization strategies.

In deciding between incremental and disruptive business strategies, teams need to take into account the amount of change both ongoing in the environment and that the Company’s strategy itself will unleash. In today’s environment of Moore’s law, with its relentless journey into the realm of the smaller, cheaper, and faster, acceleration of new technology introductions will increase. As it does that Metcalfe’s network effects law is to spread them around. In “Unleashing the Killer App” it was argued that combination of Moore’s Law and Metcalfe’s law becomes the Law of Disruption. This law can simply be stated as follows: social, political and economic systems change incrementally, whereas technology changes exponentially as shown in the “Relative Rates of Disruption” figure. This is particularly true with respect to cyberspace. It is not about computers anymore, it’s about living.

Business strategies also have to take into account this increased rate of technology change. To create new products and services in this environment, the range of partnerships that must be considered is shown in the “Partnership Options” figure. The high technology environment moves to options to the far right of the curve. As covered in the “When and How to Access External Technology” chapter, good partnerships make for an excellent business strategy, or on the other hand, poor partnership management can just as easily be an organization’s undoing.
Strategic Planning for Disruptive Growth

The classic book on disruptive business strategy is “The Innovator’s Dilemma”. Christiansen makes a distinction between which technologies are sustaining and which are disruptive. He also points out that disruption can occur when the pace of technological progress outstrips what markets need. He also assets that customers and financial structures of successful companies color the heavily the sorts of investments that appear to be attractive to them, vis-a-vis certain types of entering firms. The “Impact of Sustaining and Disruptive Technology Change” figure shows concisely the issue. Disruptive technological innovation is a step change gap in the relative performance vs. cost that two different technologies offer. The impact of performances demanded at the high and low end of the markets is also a gap to be exploited.

The reason why disruptive business strategies are not undertaken by existing companies is because for them, investing aggressively in disruptive technologies is not a rational financial decision for them on three accounts. First, disruptive products are simpler and cheaper; they generally promise lower margins, not greater profits. Second, disruptive technologies typically are first commercialized in emerging or insignificant markets. And third, leading firms’ most profitable customers generally don’t want, and initially can’t use, products based on disruptive technologies. It is not until emerging technologies capabilities increase of the point where they intersect the low-end of another market that disruption occurs as shown in the ”Intersecting Trajectories Of Capacity Demanded Versus Capacity Supplied In Rigid Disk Drives” figure. Disruption occurs because the increase in technology’s ability to deliver performance outstrips the market’s capacity to absorb that increased performance.

Another way to look at this graphically is to look at the “Disruptive Technology S-Curve” figure. Note that graphing disruptive innovation is a bit tricky because by definition the vertical axis of product performance must measure different attributes of performance than those relevant in the established value network. Because a disruptive technology gets its commercial start in an emerging value network before invading establish networks, the S-curve framework is needed to describe it. Disruptive technologies emerge and progress on their own uniquely defined trajectories, in a home value network. If and when they progress the point where they can satisfy the level of performance demanded in another value network, the disruptive technology can then invade it, knocking out the established technology and its established practitioners with stunning speed. Although this is being described as technical innovation, disruptive business models have the same effect.
One of the best stories about conducting strategic planning for transformational and breakthrough growth comes from Hamel and Prahalad who shared one of President Reagan’s favorite stories. Waking up on her 10th birthday, a young farm girl rises before the sun and runs out of the barn, hoping her parents have bought her a pony. She flings open the barn door, but the in the dim light can see no pony, just mounds of manure. Being an optimist she declares, “With all his manure around there must be a pony in here somewhere”. Similarly, companies that create the future say to themselves, “With all his potential customer benefit, there must be a way to make some money in here somewhere”. A company that cannot commit to emotionally and intellectually creating the future, even in the absence of a financially indisputable business case, almost certainly will end up as a follower. The important point is that the commitment to be a pioneer precedes an exact calculation of financial gain. A company that waits around for the numbers to add up will be left flat-footed in the race to the future. A laggard is a company were senior management has failed to write off its depreciating intellectual capital fast enough, and is underinvested in creating new intellectual capital. A Laggard is a company where senior managers believe they know more about how the industry works than the actually do, and where what they do know is out of date.
Creating a future is about finding the limits of current economic engines. It’s about understanding four things. 1. What customers and needs aren’t we serving? 2. Can profits be extracted at a different point in the value chain? 3. Might customers’ needs be better served by an alternate configuration of skills and assets? 4. What is our vulnerability to new rules of the game?
Strategic planning for transformational and breakthrough growth requires changing the lens through which the corporation is viewed (core competencies versus strategic business units), only by changing the lens through which the markets are viewed (functionalities versus products), only by broadening the angle of the lens (becoming more inquisitive), only by cleaning off the accumulated grime on the lens (seeing with a child’s eyes), only by peering through multiple lenses (eclecticism), and only by occasionally disbelieving what one actually sees (challenging price-performance conventions, thinking like a contrarian) can the future be anticipated. The strategic plan is about both seeing the transformation that needs to take place and establishing the core competencies internal to the organization and available through partnering to make the transition happen.
When looking at strategic planning for Disruptive Breakthrough innovation and growth, the process is somewhat different because of several additional unknowns. In “The Innovator’s Guide to Growth” planning is divided into three parts. These are Step 1. Identifying Opportunities. This consists of identifying non-consumers, identifying overshot customers, and identifying jobs to be done. The next Step 2 of the planning process is to Formulate and Shape Ideas. This consists of developing disruptive ideas and assessing a strategy’s fit with a pattern. The last part of the integrated business technology strategy for disruptive innovation is to “Build the Business”. This step 3 consists of mastering emergent strategies, and assembling and managing project teams.
An error people often make is to assume that a great leap forward in performance is synonymous with disruption. Do not confuse breakthrough with disruption. Disruptive innovations are all about making a different set of trade-offs: offering lesser performance along one dimension in exchange for new benefits related to simplicity, convenience, and low prices. Companies that think they can successfully crack into a market by leapfrogging existing competitors and selling to the most sophisticated market tiers often end up sorely disappointed.

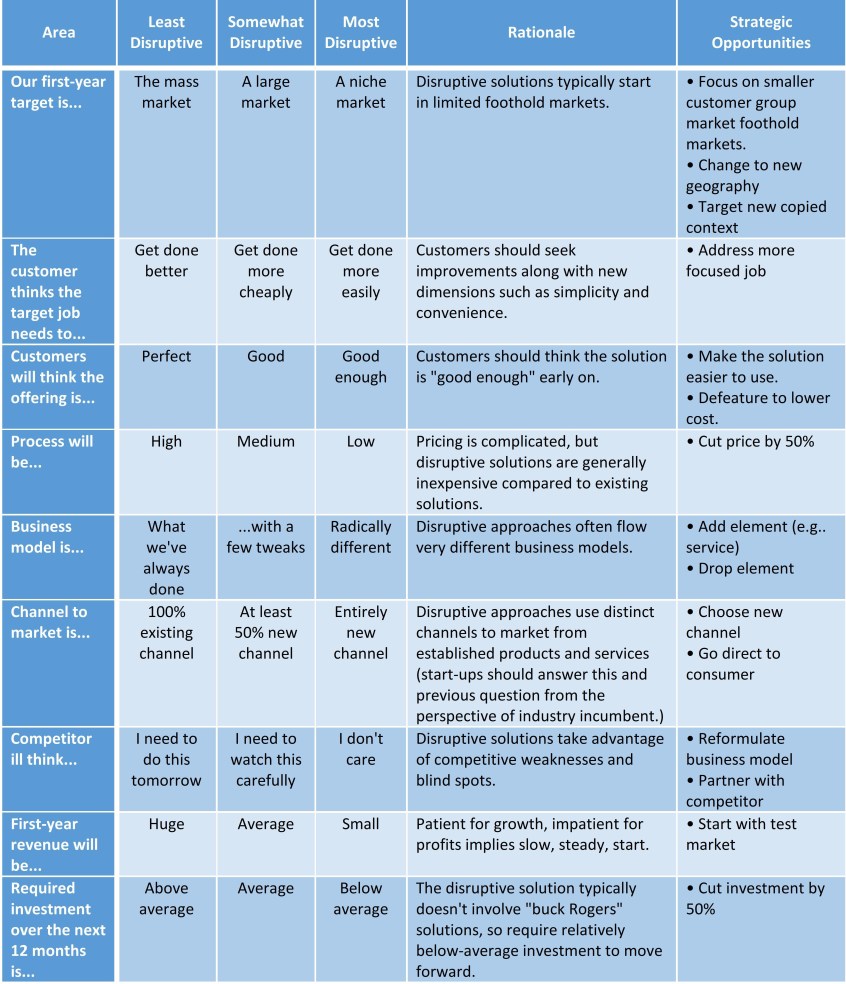
To test various disruptive business strategies the key is to identify what is desirable (what you want), what is discussable (up for consideration), and unthinkable (out of bounds). Making these parameters very clear at the outset and being willing to consider changing them as new information comes in can help ensure that teams focus on the right strategies and activities. The “Goals and Boundaries” figure uses a simple visual method to capture the corporation’s goals and boundaries with respect to alternative disruptive strategies.

When looking at hundreds of historical disruptions it has been found that the most successful growth businesses share a few key elements. The “Conditions for Success” figure describes the 12 key items Christiansen’s research and Innosight’s field experience suggest are critical components of successful new growth strategies. The first nine elements are universally applicable; the last three are specific to established companies seeking to create new growth businesses. The table lists the item and the rationale for why they are important.
Assessing a disruptive business strategy fit with a pattern of success the checklist supplied in the “Disruption Analysis” figure is helpful. It’s a self-assessment questionnaire that asks whether the assessor strongly agrees or not with the questions. Adding up the different points that come from each answer, the total gives a quick assessment of how well a strategy adheres to the successful “Conditions for Success” listed above. This allows a high level comparison of various proposed disruptive business strategies.

Another way of looking at Disruptive Business Strategy is to look for Opportunities versus Ideas. This concept by Pam Henderson focuses on “Six Sources of Opportunity” as shown in the figure. Each of these six areas is undergoing constant change and finding opportunity within them requires looking at each of these six areas carefully. Understanding the Opportunity Dimensions in each of the six areas helps in knowing where to strategically grow. As examples, Dimensions might be extensions in the age of consumers served, the wealth of consumers served, the health of consumers served, etc. By following up looking at trends within dimensions provides clues for business strategy. Note however that switching from business strategies based on new ideas to those based on new opportunities typically requires skilled facilitators’ help. But when an organization is really strapped for performance, getting such help is well worth the time and expense of doing so.
In summary, planning for breakthrough or disruptive growth is often more about setting the environment for good ideas and then adopting solid creative thinking at the Level 6 and Level 7 Thought discussed in the previous chapters. The trick for senior management team is to (1) identify that the gap exists, (2) to own the fact that the gap will need to be filled by a something that will be very different from what the company has been doing in the past, (3) with creative teams bring forward solid solutions, and (4) have the guts to fund them. The latter step is one where many companies fail. The senior management team has a hard time distinguishing how one builds on their core competence versus when the new ideas are outside the core competence that they can build. Many times it is the expertise of the senior managers that needs to change. It is a senior management that needs to be replaced, not the lower levels of the organization. Having senior managers remove themselves from a company is something that’s rarely ever done until it is far too late for the company to succeed. More often than not it’s a merger or acquisition that takes the appropriate action. Such appropriate actions rarely come from within.
Matching Asset Planning to Industry Segment
When it comes to building successful businesses there are number key strategic areas that need to be considered. They are: 1. Your intellectual property protection, 2. Your overall business model, 3. Your rapid global rollout, and 4. A uniform approach to licensing and criteria for selecting country distributors.
From a strategic planning standpoint the five pillars for building a company are 1. A platform of superb products that are building on a current marketplace trend, 2. Intellectual property protection and proprietary know-how that competitors cannot access, 3. Focus on low-cost manufacturing right from product launch as if you are successful, competitors will soon follow, 4. Build your own brand in every relevant category because as product and patents mature you need to sustain your advantaged position, 5. Have great human capital systems that help people be great at what they do.

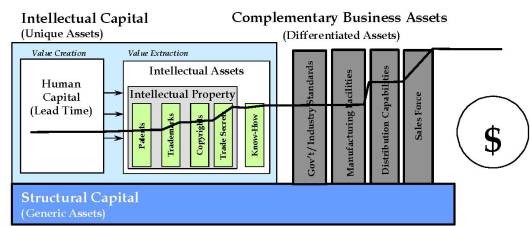
To incorporate into strategic business plans a better utilization of the business’ complementary assets, intellectual assets or intellectual capital a useful model developed by a group called the Gathering is hepful. In the “Tangible-Intangible Model of a Company” figure we see a model of a company as viewed from an intellectual property viewpoint.
Models and corporations come in many sizes and shapes. Sometimes we think that a corporation is its corporate headquarters and buildings that it owns around the world. Other times we look at a company in view of its organization chart with the CEO at the top of a tree. Other times we look at corporation through an accountant’s eyes and look at the corporation from a cash flow and balance sheet standpoint. The model of “Tangible-Intangible Model of a Company” figure is no different. It is just one other view of a corporation.
In this model we see that the structural capital comprises the generic assets of the company which are non-distinctive compared to other competitor companies. These are typically plants, property, and equipment, and access to investment that any and all companies have. It is not something that makes one company different from another. Resting on the base of structural capital we see to the right there are complementary business assets. These are the differentiated assets that make one company and industry different from one another. It might be the quality of the sales force. It might be how the sales force was trained and the type of relationships they build. Differentiation can also be based on the distribution capabilities of a company. One company may be using direct sales, another company internet sales, and a third going through large wholesalers. Factory facilities are another common point of differentiation. One company may be opening its own plant and putting together its own processes in a unique way to deliver value to customers. Another company may be outsourcing its manufacturing entirely. Another form of differentiation has to do with the type of standards that exist within an industry. To the extent a company can influence government or industry standards, i.e. the FAA in the case U.S. airplane regulations or Underwriters Laboratories in the case of electrical components, these standards and having the standards closely aligned to a company’s product design becomes another source of differentiation and competitiveness.
The third asset class of a company, and the one that is most unique and hardest to copy, is intellectual capital. A sub-class of Intellectual Capital is Human Capital. This is comprised of the individuals who are part of a company. Each person brings his or her own unique background to work and this is a point of leverage for corporation that other companies can’t acquire. Other things that are difficult for other companies to acquire are the heritage capital and artifacts that lie around the company. These can be the stories of how the company was built, the passion with which people pursue customers, the importance of quality to success, the importance of innovation to everybody. These stories are a way of doing things. They are not easily transferable from one company to the next.
Another sub-class of intellectual capital is intellectual assets. These assets are comprised of patents, copyrights, trade secrets, trademarks, and know-how (which although is not legally protected as an asset itself, an intellectual asset that is nonetheless unique and very difficult to transfer from one corporation to another). What’s important is that when a company is successful, it has taken the unique intellectual capital assets that it has and created a business model, or way of doing business, that takes maximum advantage of the differentiated business assets it possesses. For example, the way it employs its human capital matches the way in which the sales force is trained and operates. The patents that it has supports the way in which manufacturing is done. Trademarks support the branding that the sales force is known for. With this model as a backdrop will now look at how strategic planning might be done in four kinds of corporations.
The first example is shown in the “Tangible-Intangible Model of a Beverage Company” figure. This business model is typical of Coca-Cola or Pepsi-Cola in the early 1990s. The line running through the chart shows where value is added and created for a corporation. We know the big jumps are for trademarks, trade secrets, distribution capabilities and the sales force. This makes sense when you think of the traditional Coca-Cola’s formula being a trade secret and its method for going to market is selling concentrated syrups to distributors around the world who bottle that secret formula by adding water and then distributed it into the local market. What was essential for success were trademarks and trade secrets. Coca-Cola’s trademark is one of the most valuable in the world and the value of its trade secrets formula is also well-known.
What’s important for strategic planning is how to utilize this model of a company to plan better. Insight from this model and example suggests that incremental work can be done on improving business methods for selling and distribution and then next-generation or breakthrough work could be done on the manufacturing facility of the syrup itself or in government or industry standards around soft drinks in general. Likewise, innovation from a strategic planning standpoint could switch from the emphasis on trade secrets and trademarks to that of patents and copyrights. Indeed if one looks at large beverage companies today, one notices they have changed their business strategy. Instead of having few patents they have built portfolios of many, and they are focused on dispensing equipment in both large and small facilities. Pictures such as this one provide an important way to understand a company’s strengths and how these strengths must shift together to make up a new way of successfully doing business.

In contrast to a beverage company, the model for a capital-intensive paper products company is shown in the “Tangible-Intangible Model of a Paper Company” figure. Here the line running through the chart showing where value is created has a much different shape. For large paper companies creating communications paper or towel and tissue, much of the distinctiveness is created by how the market perceives equality and price point of their product. The salesforce’s ability to leverage the branding that marketing has created is a key element in creating value in this environment. Intellectual property to protect this distinctiveness lies in trademarks, as seen in the figure. Notice that the amount of intellectual property protecting the manufacturing facilities is modest. Most of the protection of the manufacturing facilities from competition lies in the fact that these facilities cost hundreds of millions of dollars to put in place. Upgrades the equipment have modest intellectual property in the form of patenting of the head box design (which lays the paper fibers down) or though the felting which carries those fibers through the drying process. Even though these machines are automate, significant operator know how is still required (especially when one knows that storm fronts are approaching which will change the pressure, temperature and humidity in the plant significantly). Such operator know how is required to keep a plant running smoothly through such upsets. It is critically important to sustain profitability and low waste in an industry that has typically low margins. Strategic planning in this area would give emphasis to improving the branding and improving small elements of design of the paper machine.

A contrasting example of where to plan for business growth is shown for a software company in the “Tangible-Intangible Model of a Software Company” figure. Distinctiveness for software often comes from capturing government or more importantly industry standards, along with forms of distribution by either Internet or an ASP model. The most important form of Intellectual Capital is trademarks and copyrights along with know-how.

Name recognition in selling is also important. From a strategic planning standpoint resources therefore should be on building the trademark, having copyrighted protection of the software itself, as well as hiring a skilled pool of software programmers. We see in this example, by segmenting a business by its intellectual capital, complementary business assets, and structural capital gives us insight as to how to go about strategic planning for new software companies who are just starting to build up their product line or service line offerings.
The last example we’re going to look at for business strategic planning is a traditional pharmaceutical company. Their distribution of assets is shown in the “Tangible-Intangible Model of a Pharmaceutical Company” figure.
Pharmaceutical companies are built on the creativity of scientists in chemistry and biology. The need for creative human capital is shown on the left side of the “Tangible-Intangible Model of a Pharmaceutical Company” figure. These companies protect that work through patents and increasingly by their trademarks as they create and promote in television and on-line advertising. There is also some know-how associated with the management of a pharmaceutical pipeline. Clearly complementary business assets include understanding of the government standards associated with delivering pharmaceutical products to the market, as well as having a sales force and marketing organization capable of promoting the product to physicians and end-use customers alike. Again looking at incremental innovation projects in this area one knows that the returns coming from inventing new drug entities is going to be much higher than that associated with improving manufacturing or distribution capabilities.
For breakthrough innovation planning, focus is on the opportunity existing in the flat areas of curves, i.e. like in the “Tangible-Intangible Model of a Pharmaceutical Company” figure for manufacturing and distribution capabilities. Disruptive work in these areas started in the early 2000’s by the outsourcing of pharmaceutical products to India and by distributing products not only to pharmacists but to go about marketing the products directly to end-users and working hard to get the products available on-line.
Strategic business planning to fill in the biggest gap is actually less about business planning and more about just being aware that the gap exists. Planning projects at this level is usually not productive. If any planning is to be done is usually associated with the perspective that the senior team possesses: the values of the company, the way in which people are motivated, and the way people are given the freedom to work on new ideas. Attempts to try and quantify this have met with limited success. The book “Built to last, successful habits of visionary companies”, by Jim Collins, HarperCollins publishers,2002, is one example. James follow-on book “Good to great”, HarperCollins publishers, 2001, talks about the Level 5 leadership required to make the transition. These elements of managing people and a growth environment are discussed in the human resources section later. Another good book on this topic is “The Innovator’s Dilemma: The Revolutionary Book that Will Change the Way You Do Business” (Collins Business Essentials) by Clayton M. Christensen (Paperback – Jul 25, 2006). It discusses how to go about planning for breakthrough growth.
What Stakeholders Expect In Business Strategic Plans – Boards and VC’s
When talking about strategy it’s important to understand what the company Boards and the CEO are looking for. Both the Board and CEO are responsible for assessing and approving the strategic direction of the company. Understanding the 20 questions that the Board should ask about strategy is also good guidance for those creating the strategy. The 20 Questions are:
Question 1. How is strategy defined at this organization?
Answer 1. Formulating and articulating a strategy involves: 1. The determination of those long-term goals i.e. mission vision and values and objectives which reflect an organization’s sources of competitive advantage and which address important stakeholder needs; and 2. The identification of scope or domain of business activities within which those goals and objectives are to be achieved. .
Question 2. What are we ultimately trying to accomplish and where do we eventually want to get to?
Answer 2. The vision goal .
Question 3. What is our purpose or why do we exist?
Answer 3. The mission goals. Who are key stakeholders, and what specific needs do we try to satisfy better than our competitors for these key stakeholders.
Question 4. What are the internal ethical and cultural priorities that attract stakeholders to us?
Answer 4. The value goals.
Question 5. What are the specific measures and targets we use to judge our progress in achieving our macro level vision, mission and values goals?
Answer 5. The objectives.
Question 6. What specific business arenas have we chosen to operate in for the purposes of achieving our objectives?
Answer 6. The product market scope and domain sections. Who and where our customers are and what products and/or services we provide to them.
Question 7. Is this organization’s strategy shared by all directors and management?
Answer 7. Everyone needs to know the strategy because “if you don’t know where you’re going, you’re probably going to wind up somewhere else.” anonymous.
Question 8. What are the major business strategies making up the overall corporate strategy?
Answer 8. As a company diversifies there may be multiple business strategies at play. It is at this point that the corporate strategy becomes something separate and distinct from the individual business strategies.
Question 9. Do circumstances warrant the Board’s involvement in the organization’s operating plan?
Answer 9. The Board should generally not get involved with operating plans because this is what management is hired and paid to do. Three exceptions to this general rule are: A. When an organization is faced with a crisis and requires whatever benefit the Board’s collective wisdom has to offer; B. When very small companies are involved and the Board is been recruited specifically to advise at the operational level; or C. When there is agreement with senior management concerning the Board’s involvement in this area.
Question 10. Does the organization have the right strategy and, if not, what should it be?
Answer 10. As a first step in assessing an organization’s strategy, it is imperative that it be formally written down and communicated explicitly to all Board members to give them an adequate opportunity to reflect upon and ponder the choice of goals, objectives and product market scope embedded within it.
Question 11. Was a process followed by this organization to formulate the strategy contained in the strategic plan and does the plan’s documentation contain all of the proper information?
Answer 11. One of the initial ways in which Board members can determine the quality of an organization strategy is knowing whether it was developed through a systematic and rigorous assessment process or more through a gut feel and back of the envelope approach. That said it’s important to remember “it’s not the plan that is important, it’s the planning” by Dr. Graeme Edwards.
Question 12. Does this strategy have the right vision?
Answer 12. As a general rule, visions are concerned with achieving organizational greatness in one or more dimensions be it, market share, quality, revenues, profits or admiration,. One of the most famous vision statements ever created was that of General Electric under the leadership of CEO Jack Welch who stated the corporate vision was “to become the most competitive enterprise in the world by being number one or number two in every business in which we compete” .
Question 13. Does this strategy have the right mission?
Answer 13. The Mission statement is a written document that is intended to capture the organization’s unique and enduring purpose of practices. It is responsibility of the Board to ensure that the organization’s mission statement acknowledges the importance of multiple stakeholder groups to the organization’s long-term survival and a balance of competing interests is achieved. Mission statements must also be grounded in reality.
Question 14. Does this strategy have a proper statement of values?
Answer 14. For an organization it is important that the actions and behaviors of its employees can with stand the test of public scrutiny. Directors need to make sure that their organization strategy contains a statement of values which they consider important for the successful, harmonious and ethical running of their business operations.
Question 15. Does strategy contain objectives which are well formulated and well stated?
Answer 15. As a general rule objectives should be established for each of the goals contained within the mission, vision and values. Objectives should be specific to avoid ambiguity as to what the organization is trying to accomplish; measurable (to allow for the determination of the objectives achievement or not); acceptable (to ensure that the method for measuring progress against the mission, vision and values is perceived as fair); and timely (organizational objectives are best stated for a time period of 1 to 3 years and revised at the end of each year as new information becomes available) .
Question 16. Are the business arenas specified in the organization’s strategy the right ones?
Answer 16. An organization should strive to identify and focus its resources on those business arenas (existing or new) where (a) the potential market opportunity exists for the enterprise to achieve its stated goals and objectives, and (b) the organization has the internal resources, either on hand or quickly available, to pursue and capture the opportunity.
Question 17. Have the proper organizational units been selected, designated and aligned to reflect, reinforce and support the strategy?
Answer 17. The method by which organization executes its strategy is when it aligns its staff, structures, reward and control systems to focus on, support and reinforce the organization’s strategic goals and objectives. This is called strategic organizational alignment and directors must make sure that employees’ jobs are redefined or re-specified to take into account requirements of strategy.
Question 18. Have all the significant internal and external strategic risks been identified, quantified and addressed in the plan?
Answer 18. Directors must understand the risks associated with a particular strategy, their probability or likelihood of occurrence, and their potential impact on the organization. These risks should be spelled out in the strategic plan.
Question 19. Are appropriate mechanisms in place to provide the Board with timely feedback on the organization’s progress against its strategy, the underlying causes of any performance variance and any changes in the internal or external environments or risk factors which would cause the Board to consider altering the organization strategy?
Answer 19. Directors must monitor the organization’s progress against its strategic objectives and related risks factors. This must be done at each meeting of the full Board.
Question 20. Are the Board and its Directors constructively involved in the organization strategy?
Answer 20. The Board needs to openly and candidly discuss with the CEO and other members of senior management all elements of the strategic plan.
A special case of business strategy deals with startups. For high-tech startups the critical issues that have to be addressed by the business strategy are: 1. People in management and can they can get the job done. 2. A brilliant technology that can be commercialized. 3. A large, rapidly expanding market addressed by the new technology’s features. 4. Strategy for an unfair advantage that can be sustained. 5. An attractive price per share. When asked which is more important of the five, the resounding answer is “the right people” is number one. You want a team that has the experience and the track record to get the job done.
In the “Business Plan” figure a generic outline of the eight sections it should include is shown. As to what should be covered in each section the following is provided:
Executive Summary.
- Business opportunity, technology, product, market, management
- Proposed financing (Amount, Use of proceeds)
- Summary of five-year income statement and capital requirements
It should be brief, and it must be great. This is all about what most readers will ever scan, let alone read. It must catch their attention and answer their key questions. It should be a concise and clear description of the problem resolve, how you solve it, your business model, and the underlying magic to your product or service. It should be approximately 4 paragraphs in length. It has to entice people to read further. It should be treated as a comprehensive mini plan. Your unfair advantage for stand out clearly.
Consumer Need and Business Opportunity.
- Product and technology description
- Uses
What is a startup going to build and how? Why would a customer want it? How well will it perform? Include your product and technology here. The Marketing strategy discussion starts in this section. Start building your unfair advantage in detail.
Business Strategy and Key Milestones.
- Include one page showing cumulative cash need and head count at each milestone
This chapter summarizes the startups strategy. It includes a one-page chart showing the sequential cumulative head count and cash flow at each significant milestone.
Marketing Plan.
- Customer need
- Market segmentation
- Channels of distribution
- Sales strategy and plans
- Five-year sales forecast
- Competition and positioning
A great deal of time should be spent on this section. When the VC or other investor finishes reading it, he or she should be confident of how the startup will position its first products and why customers will value them relative to the competition.
Operations Plan.
- Engineering Plan
- Manufacturing Plan
- Facilities and Administration Plan
The section should contain enough detail to show how the startup will design and manufacturer its first products. VCs or other investors will grill founders on the realism of the schedule to get to the first customer shipment. Show total headcounts and facility requirements.
Management and Key Personnel.
- Incentive Compensation Program
- Detailed Resumes
- Organization
- Staffing Plan and Headcount Projections
It should be short and as focused as possible. The emphasis should be on directly related experience, especially track records as managers. All irrelevant experience can be omitted.
Financial Projections.
- Assumptions
- Five-Year Pro Forma Forecasts
- Income Statement
- Balance Sheet
- Cash Flow Statements
Use a simple spreadsheet model to project the startups financial success and need for capital. Include forecast by month or quarter for years one and two with annual summaries for years 3 to 5. Build in conservative assumptions. Details of revenue by product line, average selling prices, and so on, should be kept in backup files in case they are called for.
Appendices.
These are not often used. They contain photographs or copies of market research projections. Appendices should not be filled with bulky backup data.
Presentation.
Text totaling 30 to 50 pages is typical of what is written. Try to cut it to 12 pages for the presentation. The shorter the presentation the better, although short ones are hardest to write. A good slide deck has 10 slides, using 30 point font, containing the following 1. Title slide. 2. Problem. 3. Solution. 4. Business model. 5. Underlying magic. 6. Marketing and sales. 7. Competition. 8. Management team. 9. Financial projection and key metrics. 10. Current status, accomplishments to date, time line, and use of funds. Plan on getting through these 10 slides in 20 minutes.
When it comes to getting help for the startup always focus on the function you need, not the form it takes. For example, proper accounting does not mean retaining a big name firm (form) and then assuming the job will get done (function). What’s important is a function, not the form.
What can be seen from the above example is that when it comes to business strategy it’s important to be very specific with respect to the product’s or service’s differentiation. What really counts for success is the ability to provide a product or service that has a unique set of features that are very highly valued by the customer. Most business plans fail to research or articulate carefully enough how the new product or service is differentiated from others. From a value standpoint, customers need a “compelling reason to buy”, as stated by Doug Hall. “Compelling” is the operative word here.

To get a new business, or a new business line, started you have to start in a small niche, establish a beachhead, and move out from there. A beachhead in this context means a market that is small enough so that larger competitors are not already going after it, and big enough so that if you’re successful, you can reach critical mass and profitability with it. The “Differentiation Versus Value” figures show how this is best done. In the upper left quadrant are stupid companies. They are producing products or services that no one cares about, but are unique. In the upper right quadrant you find the area that you want your new product or service to occupy. It’s where consumers most appreciate you and margins are good because you can provide something unique that they strongly desire. The lower left quadrant is a corner that many .com losers occupy. They provided goods and services nobody cared about, and many companies were doing the same thing. In the lower right quadrant companies find that life is a continuous price war. Sure people want to buy when you make, but lots of other companies have similar offerings. You can be successful here but life is a grind and there’s no margin for error for a new entrant.
Sources, References and Selected Bibliographic Information
1. “Built to Last”, by Jim Collins and Jerry Porras, HarperCollins, 1994.
2. “Angel Customers & Demon Customers”, by Larry Selden and Geoffrey Colvin, Penguinn Books, 2003.
3. “The Innovator’s Guide to Growth”, by Scott Anthony et al, Harvard Business Press, 2008
4. “Corporate Strategy and Product Innovation”, by Robert Rothberg, The Free Press, 1976.
5. “Profit from the learning curve”, W. Hirschman, Harvard Business Review, January 1964.
6. “The learning curve as a production tool”, F. Andress, Harvard Business Review, February 1954.
7. “Selecting Profitable Products”, by J. O’Meara, Harvard Business Review, February 1961.
8. “Turning Strategy Into Results”, by Donald Sull, Stefano Turconi, Charles Sull, and James Yoder, MIT Sloan Management Review, Spring 2018
9. “How do you consolidate customer needs?”, by IRI CommunityForum, Feb 2018.
10. “Interview with Martin chimes CEO, Unistraw International Limited”, by Doug Berger,The Innovators, Dec 2006.
11. “Attract, Retain, Grow”, by Maia Strategy Group, Customer Barometer, Mar. 2017
12. “20 Questions Management Should Ask About Strategy”, by Chris Bard, Canadian Institute of Chartered Accountants, 2003.
13. “Maximizing Economic Value”, presentation by Avery Dennison Strategic Planning Team, Dec. 1992.
14. “Competing for the Future”, by Gary Hamel and C.K. Prahalad, Harvard Business School Press, 1994.
15. “Product Strategy for High-Technology Companies”, by Michael McGrath, Irwin Professional Publishing, 1995.
16. “Strategy is Destiny”, by Robert Burgelman, The Free Press, 2002.
17. “Managing Product Families”, by Susan Sanderson and Mustafa Uzumeri, Irvin Press, 1977.
18. “The Innovator’s Dilemma”, by Clay Christensen, Harvard Business School Press, 1997.
19. “You can kill an idea, but you can’t kill an opportunity”, by Pam Henderson, Wiley, 2014.
20. “Unleashing the Killer App”, by Larry Downes and Chunkja Mui, Harvard Business School Press, 1998.
21. “The High Tech Start-Up”, by John Nesheim, self-published, 1997.
22. “The Art of the Start”, by Guy Kawasaki, Penguin Group, 2004.
23. “Competitive Advantage”, by Michael Porter, The Free Press, 1985.
24. “Competing on the Edge”, by Shona Brown and Kathleen Eisenhardt, Harvard Business School Press, 1998.
25. “Contrasting Strategic Plan Methods”, adapted from Strategos 1996 promotional materials.
26. “ROI –Cost of Capital Differences Between Companies” Angel Customers and Demon Customers, Larry Seldoen and Geoffrey Colvin, Penguin, 2003, p.6.
27. “Economic Profit per Customer Example”, Angel Customers and Demon Customers, Larry Seldoen and Geoffrey Colvin, Penguin, 2003, p.57.
28. “Customer Segmentation Matrix”, Angel Customers and Demon Customers, Larry Seldoen and Geoffrey Colvin, Penguin, 2003, p.121.
29. “Jump Start Your Business Brain”, by Doug Hall, Clerisy Press, 2007.
30. “Purpose of a Business Model”, adapted from Strategos 1996 promotional materials.
31. “Survival Strategies in a Hostile Environment”, by Hall and Porter, HBR, Sept-Oct 1990.
32. “Value Map”, adapted from Bain & Company presentation materials, circa 1988.
33. “Tangible-Intangible Model of a Company”, adapted from work of the Gathering I, circa 1995
34. “Tangible-Intangible Model of a Pharmaceutical Company”, adapted from work of the Gathering I, circa 1995
35. “Good to great”, by Jim Collins, HarperCollins publishers, 2001.
You must be logged in to post a comment.