
Technology Strategic Planning
- How Much Technology Strategic Planning Is Necessary?
- Overview of Technology Strategic Planning Processes
- Technology Strategy via Strategic Intent and Technology Core Competencies
- Technology Strategy via Technology/Product Function/Market Matrix
- Technology Strategy via a QFD approach with Desirability and Experience Curves
- Technology Strategy via Commercial/Technology Roadmaps
- Technology Strategy via Portfolio Analysis: Third-generation R&D portfolio planning
- Technology Strategy via Reviewing the Environment
- Technology Strategy via Reviewing the Projects
- Technology Strategy via Reviewing the Project Mix
- Technology Strategy via Reviewing the Project Commercialization Horizons
- Technology Strategy via Fourth-generation R&D; Business Process Innovation
- Technology Strategy via Business Model Canvas
- Technology Strategy by Participatory Funding
- Technology Strategic Planning Summary
- Sources, References and Selected Bibliographic Information
——————————————————————————-
How Much Technology Strategic Planning Is Necessary?
The most important strategic planning that needs to be done is from a business standpoint. Technology strategic planning is merely supportive of the business plan. Illustrating this assertion are results adapted from “Upside Down Marketing, Turning you’re Ex-Customers into Your Best Customers”, by George Walther on why customers slip away from a company. The results were: 1% dies, 3% move away, 5% find other suppliers, 9% switch for competitive reasons such as prices, 14% are dissatisfied with the product offerings and the results of your innovation management, and lastly, the largest group of 68% takes their business elsewhere because they sense that the seller is indifferent towards them. So strategic planning for incremental and next-generation innovation from a technology standpoint isn’t that critical in the scheme of things. Business strategic planning has to come first.
One way to determine when technology strategic planning is going to be important for your corporation is to consider the following: Does the organization have access to new funding (i.e. venture capital input)? Has your organization a new product introduction or new services offering that is significant? Have there been key hires or changes in senior management? Has there been a location move? Has there been a recent merger or acquisition? Has the company acquired a significant new customer? A change in any of these areas typically means that the technology strategic plan needs revamping.
The source of innovation also affects when technology strategic planning is important. If technology comes from Merger and Acquisition activity, then only light-weight loosely-coupled technology strategic plans are required. This is because most of the technology is being acquired through the merger and acquisition versus internal activity. James River Corporation, when it existed in the 1970s through 1990s, grew almost entirely by merger and acquisition efforts. As such it was business strategic planning that drove the technology strategy of the corporation and not the other way around. Cisco is another example from the early 2000s.

Yet another driving element to look at is the rate of new products introduced in the last five years as a percentage of the total sales for the past year. This metric is an indication of the degree to which the company is relying on new products or services to attract and maintain its existing customer base. The higher this number, the more important a technology strategy is to the short and long-term well-being of a corporation. The “Strategic Planning Value to a Management Team” figure shows this in graphic form. The Magic quadrant for technology strategic planning is in companies that have high new product introductions and low M&A activity.

Another guide for companies to use to determine how much energy to put into a technology strategic plan is to consider how the new technology will be leveraged. If the business is mature, the leverage obtained from investing in technology will be minimal. This is shown in the “Technology Leverage and Business Impact Based on Maturity “S” Curve” figure.
It stands to reason that as technology matures continuous investment only results in incremental change. In contrast, technology that is starting-up the steep portion of its maturity curve changes dramatically in its performance and contribution to business results with a little incremental investment. This is because enough of the fundamental research has been done to allow scientists with only little additional effort to make big improvements in next-generation offerings. Technology maturity curve also show why an investment in embryonic technology more often than not leads to frustrating business returns. The best approach in this case (we’ll talk more about this in the open innovation section later on in the book), is to partner especially with universities and research institutes to reduce risk and frustration. The reason for mentioning technology leverage curves here is to point out that many companies as they start to approach the mature phase of their technology continue to pour significant investment into R&D only to be frustrated with the result. This is because when they were on higher portions of the growth curve they experienced generous returns in performance that they’re able to pass along through new products and services offerings to their customers. When technology matures such returns dwindle. Thus, as reported in Research Technology Management, September October 2004, page 18, it’s important at the outset for R&D and business management teams to have a good understanding of where they are on a technology maturity curve before they undertake technology strategic planning.
Overview of technology strategic planning processes

Almost all good strategic planning processes start with reviewing the internal and external environments. It’s important to know what’s going on inside a company (by way of core competencies), what competitors are doing, what the industry is doing, and what world trends are. This is the background for reviewing whether incremental, next-generation or breakthrough ideas are needed and appropriate innovation capabilities are available. Lists of proposed products, services, and projects that could become a part of a company’s business and marketing portfolios are created. The next step then is the actual comparison of projects by looking both at their fit within the marketing plan and if technical capabilities exist. The last step is to summarize and review the choices that are being made. The “Strategic Planning Process” figure shows this process.

Although almost all consulting organizations and companies practicing good strategic planning agree on these four steps, the underlying methodologies often differ. Work within the Industrial Research Institute’s Research-on-Research Subcommittee found the best strategic planning methodologies have the elements illustrated in the “Strategic Plan Elements” figure.
This figure illustrations in a bit more detail how the plan develops from an environmental view (human resource, technical platforms, etc.), down through specific projects, to finally audits to ensure a company is building on in core competencies, and that the projects selected are consistent with the economic value each of them is creating for the organization.
When reviewing the projects one has lists of incremental projects that typically Strategic Business Units of a large Corporation (SBU’s) have brought forward from projects requested by key customers. Technology road-mapping that shows how next-generation projects support marketing releases over time. When summarizing all these different proposals, one of the best methods was found to use Star or Spider diagrams to be discussed later in detail. This was based on research conducted at California State University Long Beach by Betty White.
When undertaking these planning efforts it’s important to remember that the objective of such planning is to continuously develop a clear sense of strategy throughout R&D, marketing, business, manufacturing, and intellectual property organizations. This understanding sets the context for R&D, marketing, IP, and other activities. Clear roles, responsibilities, and processes for setting, validating and refining strategy with extensive cross functional participation throughout the planning process is essential.

As the technology strategic plan comes together it must be tested for its integration with the business strategic plan. A simple model for business strategic planning is shown in the “Elements of Strategic Plans” figure. It has four steps to the process.
These elements are listed in the order that they should be developed. Notice that this approach is at first very inward focused. This is designed to understand fully an organization’s core competencies so they can thoughtfully be built upon and leveraged to future advantage. When it comes to the impact on the technology strategic planning, the biggest element to remember is to use these perspectives for insight on how to change, not on how to continue to do the same old thing! Success depends upon really exploring such questions as “What assets do we own?” in the fullest extent. Remember all tangible and intangible asset categories. Remember too that some assets “owned” can really be licensed or so heavily obligated to a company that they are “owned” in a planning context. Examples are exclusive relationships with suppliers, customers, and partners. It is good to use the “Elements of Strategic Plans” figure as a template and fill out in detail the elements underneath each question. Summarizing the bottom elements, sometimes using a SWOT (Strength, Weakness, Opportunity, and Threat) matrix for each can be a powerful planning tool.
Methodologies for various types of technology strategies and portfolios will now be covered. These include methods that plan for products in the market place that are at various stages of the development along the technology maturity curve. Important for most businesses is the ability of a plan to ensure the products in the pipeline are properly scheduled for release in order to ensure smooth product transitions that meet both revenue objectives, and the sales force and manufacturing organizations’ ability to execute on the new products and services. A technology plan should discourage and dissuade others from entering the market as competitors. PWC (Product Innovation Best Practices) recommends a plan should include outsourcing products and services with the following characteristics: possesses inherently (1) low yields, (2) inherently problem prone, (3) excessive overhead demands (total cost accounting may be necessary to quantify this), (4) different processes from the bulk of moneymaking products, (5) excessive setup, tweaking, and delays, all of which cost cause low equipment utilization, (6) products “revived from the dead”, (7) where a better performing and easier to manufacture product can be obtained from others, (8) low unit sales and revenue, (9) products with limited futures that don’t fit with future strategies, or (10) those that have low or negative margins as measured by total cost accounting or EVA methods described beforehand. At first glance this seems like a significant list but it serves as a good checklist both before one starts strategic planning and then again at the end to make sure that the plans are really going to produce the intended business results.
Technology Strategy via Strategic Intent and Technology Core Competencies

The first point of view when companies embark on technology strategic planning is to make a distinction between strategic planning and strategic intent. The work by Gary Hamel and CK Prahalad underscored these differences. In their early work they attacked the application of concepts such as strategic fit (which they defined as a trade-off between resources and opportunities), generic strategies (i.e. low cost versus differentiation versus focus), and strategy hierarchies (i.e. goals, strategies and tactics). They argued that focusing on strategic intent would lead a company to better planning and resource deployment. The “Approaches to Developing Strategic Plans” figure outlines these differences.
They pointed out that the two concepts are not necessarily mutually exclusive but do represent a difference in emphasis. Through their eyes the focus of traditional strategic planning was on refining ambitions to match available resources, whereas their strategic intent process focused on a vision and how to leverage resources from all parts of the organization to reach it. Their strategic intent focus also emphasized the need to accelerate organizational learning such that it outpaced competition as a source of competitive advantage. Since the time of their original paper (Strategic Intent by Gary Hamel and CK Prahalad)R&D and business development organizations have learned, not surprisingly, that there is a time and a place for each model. When it is incremental change that is needed, oftentimes the Traditional Strategic Planning model generates a better result whereas clearly the Strategic Intent model outperforms the former when it comes to next-generation and clearly breakthrough business strategies.
Gary Hamel went on to further view the process as strategy as a revolution (“Strategy as Revolution”, by Gary Hamel). The following six elements are trade-offs that demonstrate his viewpoint. He was viewing the processes in either procedural versus creative, reductionist versus expansive, extrapolative versus foresighted, positioning versus inventing, elitist versus inclusive, and easy versus demanding. Most companies who are members of the Industrial Research Institute have since found that the most important elements of these six are (1) to be creative in the process, (2) be expansive in the inclusion of world trends including business model considerations, and (3) be inclusive of all parts of the organization including demanding inputs from competitive intelligence and intellectual property.
Another term coined when planning for an unpredictable future is “strategic flexibility”. The strategic flexibility approach draws upon scenario building and real options concepts to help managers formulate and implement strategy in high uncertainty environments. Projects that will be valuable in multiple future scenarios win over those that are not.

The reason why these elements are so important to address upfront has to do with the tyranny of companies’ Strategic Business Units. Tyranny is a strong word but it’s used for reason. When it comes to planning, people with the money get the biggest votes. What this often means is that members within an existing business unit who may be quite far up a technology and business maturity curve get to have the work that they want done undertaken by the corporation. The problem is that resources should actually be withheld from such organizations and redeployed to new products and services that are positioned much earlier in their growth curve. This is where the technology leverage is going to be. The planning methods that follow attempt to compensate for this traditional strategic planning defect to ensure that the portfolio meets the needs of the corporation’s stakeholders, not those of a powerful business unit team. The contrast is shown in the “Traditional Strategic Planning Versus Core Competency Viewpoints” figure.

In large corporations the roots of competitive advantage often come from synergy between the core competencies of the corporation that can be leveraged in products by multiple business units. However, by the late 1990s it was shown that disaggregated businesses would outperform those that stayed together. The bottom line, although it was predicted decades before, was that only those portions of a corporation that really ought to be internal are those were the competencies are interdependent, synergistic and incapable of being delivered through more than one entity. Thus on the one hand, outsourcing of a corporations “structural capital” operations often creates a more profitable corporation. On the other hand, core competencies that support multiple businesses should be kept internal. See the example from CK Prahalad and Gary Hamel shown in the “Flow of Competencies to End Products” figure.
This figure shows multiple end products being produced from different business organizations within a large corporation. In the “Flow of Competencies to End Products” figure the competencies are only supporting one or the core products and those core products are supporting multiple business units. Real synergy occurs when the competencies support more than one core product line. Such an overlap and leverage is most apparent in technology strategy maps which map technology versus product function versus market (below).
Drilling deeper, core competence is defined as a combination of skills and experience vested in people, supported by technology, processes, assets, and values. Core competence is integral to an organization’s success because it yields a fundamental customer cost benefit and provides competitive differentiation. Another definition of core competence is a combination of skills or experiences that can create a sustainable competitive advantage.

A test to determine if a set of skills comprises a core competence has four sub-tests. The first sub-test is one of “customer value”. Does the proposed competence make a disproportionate contribution to customer perceived value (functionality and/or integrity)? Can a company realize a significant price premium or cost advantage in delivering this value? The second sub-test of a core competence is a “reality” test. Are we distinctively better than our competitors? Core competences are often defined as ones and make a distinctive difference in doing things as compared to competition. The third sub-test of core competences regards “defensibility or sustainability”. Is the corporation’s level of competence competitively unique? Would it take competitors significant time and resources to replicate or close the competence gap? A practical way to test for this is to look at the cycle time of new products and services being offered in a company’s industry segment. If the competitor can reproduce the product or services in less than 20% of the cycle time it’s not a core competence. Final sub-test of a core competence is “leveragability and criticality”. Can the corporation leverage the competence into an array of new products? Is a competence critical to the company’s industry position? Is a competence an important gateway to the future? The “Example of Disney Core Competencies” figure shows a hypothetical set of skills, technologies, and assets that lead to Disney’s core competencies of storytelling and set management.


This listing of customer benefits, consumer products and services, core competencies, and skills and technology is not meant to be complete, but rather illustrative of the role core competencies play in delivering consumer benefits to customers. Seen in this matrix is how core competencies tie together many different skills and technologies and deliver them to consumer products and services. Knowing a corporation’s core competences gives real guidance to technology planning. In this Disney example one knows how the skills and technologies that are being developed are benefiting not just the Disney product and services, but also the way in which they enable either storytelling or set management to become unique in design or cost advantage. It is highly recommended that this matrix be used as a template as any company embarks on putting together its technology strategic plan. A blank representation is shown the “Core Competencies Template” figure and a worksheet sheet leading up to this graphic is shown in the “Core Competencies Worksheet” figure.

Importance of core competencies in technology strategic planning can be further understood when one also thinks about “hidden” competencies. To illustrate core competencies that may be hidden in a company, the “Examples of Core Competency Areas” figure provides some ideas on what they might be and where to look for them.
Planning for the technologies around the next generation of Intel’s micro-processor is perhaps straightforward. But thinking of the brands of Coca-Cola and were innovation will play in their future it becomes a little bit different. For example, in 2001 the Coca-Cola brand was being taken into many different regions of the world. Drink customization was a critical success factor. Hidden core competencies that Coca-Cola was leveraging to support their initiative were manufacturing line innovation, business model innovation, service innovation, and information technology innovation.
Technology Strategy via Technology/Product Function/Market Matrix

One of the most powerful technology planning tools is shown in the “Overview of Technology / Product Function / Markets Matrices” figure. This matrix is comprised of technology, product function, and market segments.
This matrix is a good tool for a company to use when understanding where its competency leverage points are. Listed in the columns of the left-hand matrix are the different Technologies that a company has. The rows down the center of the two adjoining matrices are filled in with the Product Functions that the Technologies or Competencies create. The columns of the right-hand matrix are labeled with the industry segments that utilize these Product Functions. These paired matrices were a significant improvement over the previous method of simply listing technologies vs. markets in a single matrix. This two matrix planning tool allows for planners to visualize new markets where technologies may be developed or licensed for additional business (via the Product Function coupling).

To explain this planning tool further, the “Technology / Product Function / Market Matrix (left half)” figure shows an example for one company their relevant Technologies and Product Functions. The order of the technologies is set according to their position in the value chain. In this example we see first the materials portion of the value chain, flowing into the manufacturing or fabrication methods. These are followed by the converting and printing operations. Lastly are the packaging systems at the end of the value chain.
The far left columns relate to the scientific disciplines or research infrastructure that are associated with underpinning the other technologies. In this example under technology infrastructure we see computer modeling, polymer characterization, databases and others.

The rows down the center of both matrices relate to the “Product Functions”. This concept was developed to BCG and Pugh Roberts Associates several decades ago. The power of “Product Functions” remains useful today, especially for larger corporations. Product Functions link technologies and markets together in a way that facilitates strategic planning. Product Functions are associated with the benefits a consumer or customer receives. Product Functions are best organized by Consumer Benefits as shown in the “Technology / Product Function / Market Matrix (right half)” figure. The “x’s” in the matrix elements indicate which Technologies can be used to create which Product Functions.
In this example matrix the Benefits shown are those related to green packaging issues, the convenience of the packaging, health concerns, aesthetics, packaging efficiency, serviceability of the product, and product quality. Specific Product Function features in each of these areas are shown as RCP levers or Product Features in the “Technology / Product Function / Market Matrix (right half)” figure. These are attributes that can usually be determined by market research or quality assurance investigations. As one example, in the case of the customer benefit being packaging efficiency the corresponding Product Functions are listed as surface friction, sealing temperature, and mechanical stiffness and strength.
The right-hand matrix of this tool ties consumer benefits to the different market segments that a company will serve. In this example, for consumer and food packaging, one sees these areas are snack products, cereal, candy, coffee, etc. The “x’s” in the matrix elements again indicate which Product Functions are of value in which Market Segments.
Shown by axes in this part of the figure which of these attributes are most important to a specific industry segment. Some models ask that the presence of the “x’s” be rank ordered on anchored skills of 1-5 or 1-10 gradients. It’s often found that it’s easier to just put in a place-holder “x” based on a simple determination of subject matter experts’ viewpoint, on whether or not it is an important interaction or not. Later for those areas initially showing the best opportunities, they can be refined from “x’s” to anchored scale values using quality functional deployment methodology (detailed below).
There are times when it is advantageous to really look at key customer accounts in each industry segment as shown in the upper right-hand matrix in the “Technology / Product Function / Market Matrix (right half)” figure. This becomes especially important if there are customers holding intellectual property rights which might impact if the consumer benefits can be offered exclusively or non-exclusively to particular group.
Tying this matrix back to the previous discussion of core competencies one can now see at a glance on one page how the core competencies from a technical standpoint tie to the marketing and sales competencies on the right-hand side. The matrix also allows the human eye to spot areas of leverage and areas where gaps need to be filled. Color coding the technology strategies (for either new programs or existing programs) associated with specific marketing and business strategies (for new business or existing business) again allows at a glance to see points of synergy and leverage.
Technology Strategy via a QFD approach with Desirability and Experience Curves

Technology/Product Function/Market Matrices can be tightly integrated into companies’ quality function deployment or QFD or Six Sigma methodologies. A typical phased approach to QFD based planning is shown in the “Four Phases of QFD Analysis” figure.

Phase 1 of this 4-phase approach is product planning. Customer requirements are typically matrixed against the technical requirements. In other words “what we need” against “how will do it”. We saw above that it’s often important to match not only customer requirements, but be thinking about the Customer Benefit or Product Feature/Function. Adding a column for Customer Benefit or Product Feature/Function to the Customer Requirements column on the left side of the Product Planning matric enables linkage to Sales and Marketing materials and efforts. An even more sophisticated and insightful approach is to use three columns: (1) customer requirements, (2) customer features, and (3) the Desirability Function Curve shape. An example of these three columns is shown in the “Relating Customer Requirements to Benefits via Desirability Functions” figure.
The column showing the desirability function is extremely important especially when we think back to a technology maturity curve. Customer requirements are often put as minimum or target. In fact what the customer is going to buy is based on their perceived value as being plateaued, linear, increasing, or exponential. Knowing which of these five curve shapes applies to the customer’s perceived value helps tremendously in determining which technology is going to best meet the product or service requirement. If only a little change is needed in the customer requirement and the customer’s Desirability Function Curve shape is only slightly higher or flat, then an incremental technology approach is most appropriate. On the other hand if there is significant customer benefit to increasing the customer requirement, or the Desirability Function Curve is bent, then next generation or breakthrough technology are the appropriate ones to invest in (especially when one applies principles of strategic intent versus strategic planning).


In order to give the elements of QFD a strategic perspective Experience Curves are often utilized. Experience Curves for cost are fairly robust across many industries. Three examples are shown in the “Experience Curves” figure. Technical strategies to achieve a roughly 80% slope in price reduction are a good planning tool. These curves can be applied to personnel as well as products as shown in the “Planning for Personnel Cost Reduction” figure. Developing technical strategies to improve the productivity of personnel, especially in service industries, is an important strategic planning element.
However, as practiced at Alcoa, also taking into account the theoretical limits of materials and processes is very valuable in the context of technology planning. The theoretical limit sets realistic or at least likely upper bounds on the advancement of any specific product feature, or lower bounds on the cost reductions available.
The recent work in cyber physical systems / machine learning tools must also be considered when using Experience Curves to predict the future for strategic planning. The curves can be disrupted by deep neural network tools that offer significant advantage in the process space over modeling methods requiring less extensive and less specialized computation.
Technology Strategy via Commercial/Technology Roadmaps
By way of introduction, it’s important that product and technology roadmaps are developed through collaborative efforts of the management, senior business and technical personnel. When roadmaps are the appropriate planning tool they need to be reviewed and updated periodically, typically at least quarterly for most corporations, to ensure that they remain relevant to the changing circumstances and evolving business direction. The strategy must also be built on core competencies that are owned and required to ensure a competitive advantage. The procedures it should be apparent in setting R&D strategy are ones that ensure that, risk reward and stability and growth balance is maintained, resource allocation decisions are appropriate, relevant knowledge is transferred across projects, and previous product and process investments are leveraged.
From technology strategy standpoint the highest business priority to sustain and grow the business at slightly above the industry participants’ average can usually be accomplished from incremental technology or next-generation technology. Identifying gaps typically comes from customer requests, or technology / business road-mapping. Road-mapping either businesses or technologies gives a planning team the sense of where an industry has been and where it is going. It also highlights the rate of change that is going on in an industry segment. The rate of change corresponds directly to the number of technology resources that are likely to be a needed to remain competitive.

Road-mapping corporations and road-mapping technologies have been well researched and published. Examples of road-mapping in the corporation were published by Richard Albright and Thomas Kappel in Research Technology Management, March-April 2003. Their overall process is shown in the “Process of Creating a Technology Roadmap Plan” figure.

Also shown in their paper are experience curves as described in the section above. These experience curves are many times overlooked in technology strategy planning. They are the Moore’s Law for traditional companies. These curves have been constructed for many industry segments and many products and services offerings, and the log-log relationship between the market price per unit and the cumulative units sold turns out to be surprisingly straight lines (see the “Example Experience Curve” figure).
This relationship is particularly important and useful when one goes about planning price and performance targets for incremental new products and services. It is especially useful for an ongoing business. Plotting past history and either a product feature (such packaging peel force for opening) versus time on log paper, it’s apparent whether or not the sales and/or marketing organizations are expressing customer needs that will fit on the experience curve and will be addressed by improve current technology as more experience is gain, or is the sales / marketing request a break from the experience curve and will require a new different technology to satisfy the need. Using this methodology is extremely powerful in the selection of the correct product posture to use at the project level. It is either incremental, next-generation, or breakthrough posture that will be required….and the experience curve tells us which posture has the best chance of a successful business outcome. A common mistake is to assume that an incremental posture is appropriate, and thus approve project plans, fund and resource them at that level and with that strategic intent. Behaving this way, when it is clear that a next-generation or breakthrough is needed, is nothing more than a waste of company resources.

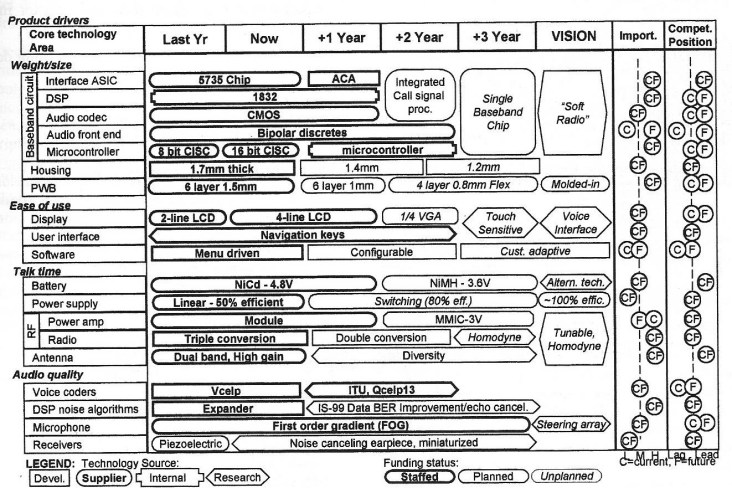

The key element for strategic planning from technology roadmaps is that they highlight technology project options that can be selected depending on the market or environmental triggers that occur. Example technology roadmaps are shown in the “Generic Technology Roadmap” figure, the “Example Cell Phone Technology Roadmap” figure and the “Example Automotive Radio Technology Roadmap” figure.

To get to these roadmaps, oftentimes companies use the intervening step shown in the “Linked Technology – Product Features/function and Market Drivers-Product Features/function Grids” figure. The latter shows decoupling the two matrices of our technology / product function / marketing maps, but for many organizations doing them together with one combined integrated team is more insightful.
Whether the two matrices are done individually or together, the methodology is to have project selection teams score the individual attributes on an anchored scale, one against the other. For example each product feature is ranked against the market driver for importance, as seen from the business and market perspective. Subsequently these product features are used to rank the technology solutions or projects. Each proposed technology solution or project is then rank ordered for its likelihood in delivering the product feature required in the timeframe specified. Combining the two matrices, they become a scoring model that allows ranking the technology solutions or projects against market needs.
Remembering that this process is designed are for incremental changes in product features, and incremental technologies needed to address those new features, this work can be done quickly by experienced teams. Also the degree of error in putting together such matrices is small because both the markets and the technologies are well understood by the evaluating teams.

Finalized maps showing technology evolution in a particular area are shown in the “Visual Display of Technology Roadmaps to Senior Management” figure. These integrated maps highlight market triggers, product evolution, technology developments and issues all put together in one picture. Such roadmaps are often good for individual business units but for large corporations such tools tend to be cumbersome when presented to senior management teams. As a result, a summarizing methodology is more appropriate as will be shown later.
In “Starting-Up Road-mapping Fast” the case was made for using technology and business roadmaps to improve customer relationships. Road-maps allow for better communication regarding how a company is going about meeting the requirements placed by key customers. Road-maps also strengthen the business engineering interface. They create a clear product / technology vision and strategy. The improvement in communications that results more than pays back the effort required to undertake such detailed planning.
Companies using Road-mapping methodology are usually manufacturers of large systems where the components need to be integrated in a particular time frame. Planning in this way, based off of trigger points, improves time-to-market and allows a team to look far enough ahead to define future products and their entry points. Clearly such methods do not work for companies were future next-generation or breakthrough products can’t yet be defined. But when used for incremental new product planning, this methodology allows for quicker “out of the gate” alignment, highlights critical technology developments, and how to get the critical developments off of the overall program-critical path (so the overall system is delivered on time and the contingency for component development failure is accounted for). These maps also provide real opportunities to identify where partnerships and Open-Innovation can play a key role.

Some planning tools put in a matrix “products versus technologies”. This matrix is shown in the “Relating a Product Technology Matrix to Technology Roadmaps” figure.
In traditional strategic planning these for matrix quadrants are divided up by priority. However, what is shown in the “Relating a Product Technology Matrix to Technology Roadmaps” figure is how a technology roadmap reconciles the priorities set for different programs that fall in the different quadrants of the matrix over time. In this graphic display rather than prioritizing Phase 1 then Phase 2 then Phase 3 then Phase 4 in doing projects, the technology roadmap reconciles the priorities and shows how they should each be undertaken over time. Further, as time progresses the appropriateness of the technology can be re-evaluated. This simple matrix can be used to identify the Phase of each project on a roadmap, and if so color coded and put on a road map that shows flow over time a much more powerful planning and communication tool results.

The other feature of road-mapping is that it helps illustrate a vision of the future. The simple easy-to-understand graphic of a roadmap shows how everyone in an organization can contribute over time. In the “Generic Roadmap Architecture” figure, essentially the whole value chain surrounding the company or product is mapped so that additionally complicated interrelationships and competitive positions are easily seen. The roadmaps also help visualize how products and technologies evolve, and thus allow senior management to see why some technology options must be pursued in a simultaneous manner.


Reporting progress on technology roadmaps to senior management is sometimes best done by simplifying the graphic display. This can be done by only showing the technology progress of a single unit, a company, or an industry segment. Examples are shown in the “Simplified Technology Roadmap Example of Pressure Sensitive Adhesive Release Technology” figure and the “Simplified Technology Roadmap Example of Electric Heaters from Conductive Polymer Materials” figure.
The “Simplified Technology Roadmap Example of Pressure Sensitive Adhesive Release Technology” figure shows how release technology for pressure sensitive adhesives in the 1990s shifted from solvent based systems to those using water emulsions and then on to systems without solvents that required no removal of a volatile material. It also shows the final progress of the technology to a solution that didn’t require a release coated backing strip at all.
The “Simplified Technology Roadmap Example of Electric Heaters from Conductive Polymer Materials” figure shows how a company developed electrical heaters over a number of years in the 1970s. Although the example is old, it is still true today that senior management teams can grasp much faster than other displays of such information the concept of a tree with products growing from its branches, and the technologies supporting them growing downward from the roots. Transforming traditional technology roadmaps into graphic displays that have physical meaning is a useful exercise for most senior managers and director board members. In this example in each of the product lines are shown as buds growing off the tree limbs and successful product will launches are shown as flowers. Underneath, the elements of the root system to show the technology’s progress over time.


From a strategic planning process standpoint building roadmaps is usually done with cross functional teams. Two such generalized processes from different authors are shown in the “Example Process to Create Technology Roadmaps” figure and the “Example Process for Technology Roadmapping” figure.
The common elements in setting up the process include looking for information from outside sources and understanding market trends through voice-of-the-customer gap analysis. This is followed by looking carefully at the near-term product needs and product strategy. Groups work to construct roadmaps looking at the technology solutions and then linking the technology resources to customer needs (that are projected to evolve over time). The last step is of course to envision the future and make sure that the technology roadmap meets the company’s strategic intent and strategic architecture as discussed above.
For companies that are faced with incremental and next-generation product development that takes place over an extended period time, technology road-mapping is a powerful planning tool. Companies inappropriately shy away from using such a process however because for companies that haven’t used it before, this process seems like it would take a long time and could be cumbersome. In fact, under guidance from trained facilitators, these processes usually can be done in three to four half-day or day long planning sessions. Thus extremely valuable output can be obtained for very little input time.
Embedded in the technology road-mapping process is a strategic project selection process. For all the project ideas in a given area that have come out of the ideation methodologies described above, these projects are initially laid upon the technology roadmap plan. In doing so the planning teams are doing two things. They’re looking at when the technology might be needed. They’re also subconsciously looking at when the technology might be available through the funded work of the project.
Technology road-mapping teams discard projects for which the technology would not be ready in time. The teams favor those development programs where the technology placed on the technology roadmap drives the whole system forward through its commercialization cycle ahead of competition. For industries that are very capital-intensive even more sophisticated models are appropriate to use. These involve the use of complex decision trees where the elements of a technology roadmap are tied together and each is assigned a probability of occurrence and a probability of technical success given occurrence. The strategic Decisions Group (SDG) located in Menlo Park, California has developed software and refined this complex process significantly over the past decades. Their methodology is to build detailed decision trees, collecting the probabilities needed for each branch of this tree in a time effective manner, and then look at overall probability of occurrence of different scenarios. They and others have refined such scenario planning to incorporate Monte Carlo simulations that allow application of probability distributions to the choices to be made at each gate.
The decision tree methodology is further refined by the use of real option choices to be made each day. Such methods are outlined in the book “Real Options”. Other real option advocates have refined such methodologies so they can be used in specific industry segments. Industry segments best utilizing such decision tree methodology are those that typically involve large capital investments over time or large systems that are comprised of many subsystems (each with their own success and failure probability distributions). Examples are oil exploration, oil production, aircraft and spacecraft systems, and telecommunications infrastructure. Because of the amount of the investment in the overall system is so large, coupled with the fact that the probability distribution of success at the component or subsystem level can be predicted with some accuracy, and allows his methodology to be used well.
Industries that have rapid cycle times such as computer gaming, cell phone technologies, etc. are not good candidates for these methods. In these industries the assumptions that go into the Decision Tree Gates are poorly understood. The probability distribution of success or failure is more of a guess than a fact by all but the most experienced personnel. At this point the approach starts to lend itself better to Delphi technology versus decision trees.
For most company’s the simple technology roadmaps described earlier are more than satisfactory for creating a good technology strategic plan. When uncertainty starts to increase, technology strategic plans are best constructed using the “next-generation” or “Horizon 2” strategic planning tools in the following section.
Technology Strategy via Portfolio Analysis: Third-generation R&D portfolio planning

The book “Third-Generation R& D, Managing The Link To Corporate Strategy” shared solid strategies to plan when undertaking next-generation projects. This classic book advocated what should really drive R& D and business strategy was a relationship between risk and reward in R&D investments. The most famous graph is shown in the “The Desired Relationship Between Risk And Reward in R&D” figure.

When R&D projects are plotted on such a matrix it is pretty easy to see which ones make the best bets. Everybody loves a high reward low-risk project. The trick however is to decide how to place projects on the grid. The potential reward from the project is oftentimes estimated by marketing from market research. As mentioned earlier many R&D projects fail on commercialization not because they were technically unsuccessful but because they did not achieve the expected marketing predicted returns. This speaks strongly in favor of solid fourth generation and advanced marketing methodologies that we will discuss later. That said when good marketing inputs exist, this graph this graph serves a very useful purpose. For next-generation work it assumes that a company is already in a business and the marketing and product management have a good feel for the benefits in terms of increased market share, profits, and returns to the company that introduction of a new product feature will bring. For R&D organizations, the trick is to place the risk of a project accurately. The methodology used for such an assessment is shown in the “Typical Elements of Project Risk” figure.

In the table shown the units used to assess a project range from words, to numbers, to time, to dollars. This inconsistency of units sometimes causes problems when R& D organizations try to utilize this methodology. An improved method as we see later is to move all these units to an anchored scale (typically either 1-5 or 1-7). An example is shown in the “Project Scoring” figure.
In the example shown we see that each of the criteria is given a weighting factor as well as a rating within that factor. This results in a final score which it is then summed to give a total for each project in the portfolio. The logic is that those projects that score the highest are the best suited to bring forward within R&D. This methodology is used in many organizations with many variants. A deficiency is that this process requires weighting factors. These are much more difficult to ascertain than scoring based on a set of anchored scales. Thus some organizations prefer the latter means to score technology risk elements.

These methods work well for projects that are more in the development versus research phase of exploration. For the latter, as shown in the “Scorecard for Evaluating and Screening Opportunities” figure, it’s important to include the building of knowledge capabilities into the ranking scheme.
The objective of all these planning methods was to tie business needs to technological selection criteria. By the 1990’s being able to make a business case for all R&D projects became an imperative. The work described in third-generation R&D was some of the first on a pathway to improve R&D productivity and results. It facilitated the move from R&D being an isolated function (often characterized at the time as an ivory tower) to one that became an important component of business unit growth.

One variant of the risk vs. reward matrix of the “The Desired Relationship Between Risk And Reward in R&D” figure was developed further by the Monitor Group. They observed that most corporations at that time were heavily focused on incremental “core innovation” to the exclusion of next-generation (adjacent innovation) and breakthrough (transformational innovation). Examples of each category of innovation at that time are shown in the “Types of Innovation” figure.

Using a variant of the Risk vs. Reward matrix, the Monitor Group surveyed companies to determine and display the Average Resource Allocation Ratio (note some industries varied from this average) and the Average Distribution of Returns. Whereas the original wording contained in the “The Desired Relationship Between Risk And Reward in R&D” figure steered companies away from risk, the results from the more recent Monitor Group work shows how important breakthrough work is to long-term corporate success (see the “Risk vs. Reward Matrix Variant and Associated Distribution of Returns” figure).
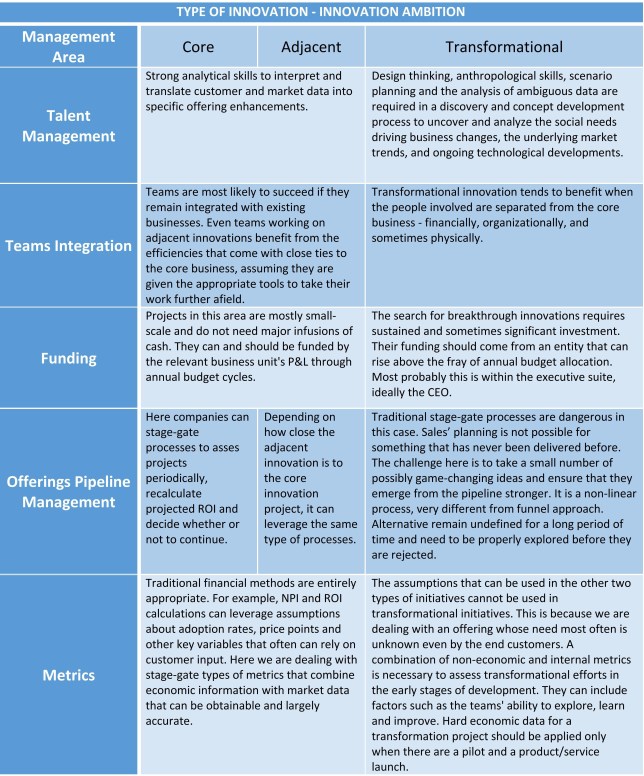
The use of breakthrough projects to enhance a technology strategy seems compelling. It however requires a completely different set of capabilities and processes to be successful. It is this requirement to fund and manage breakthrough ideas differently that presents barriers to incorporation of such projects into technology strategies. These differences are outlined in the “Capabilities and Processes Required of Projects in Technology Strategies” figure.
The need to incorporate next-generation and breakthrough innovations into a company’s technology strategy is an important corporate need. As such more complex approaches to developing an appropriate technology strategy were created. The goal for such approaches was to incorporate more market and technology insights into the technology strategy process, while at the same time reducing the manpower expended to create and explain the results.
Technology Strategy via Reviewing the Environment
The reviewing the environment approach to technology strategic planning consists of looking both inside and outside the company for patterns that affect the technology project portfolio. What follows are a mix of methodologies from various sources. They allow a corporation to see clearly the environment in which they are operating. Although many of the graphs and tables may seem indirectly relevant to the company, they are best used when the company and competitive products / services are put on the same map.
The examples are provided in the sense of being illustrative. When picking the method(s) that are right for a particular company, it is important to use some common sense as to which are applicable and which aren’t. Much of knowing what it is good and most appropriate involves discussions with technical, marketing, sales, manufacturing, and general managers. What is most important is to understand what is distinctive about a company and how to best “see” that distinctiveness in a way that allows insight into what to what to do next.

The first “view” is one that relates R&D strategy to the relative investment opportunity (a combination of the product or industry segment sales growth rate and percent market share). This graphic is best used when both the company’s and its competitor’s products are placed on the same matrix. It is not uncommon to find that when company’s use the “R&D Strategy related to Relative Investment Opportunity” figure they often find projects underway where the R&D strategy was mismatched to what the market growth rates and company vs. competitors positions indicated would be a wise approach.
Because this matrix is so helpful, each element in this will be reviewed. In the upper right area the R&D strategy is to conduct “maverick” (synonymous with breakthrough) research or “don’t play”. In this case where you have low market share and a high growth rate the only way to take customers away from companies which have done things right or in a manner to gain large market share vs. yourself, is to offer customers a truly distinctive reason to switch. R&D has to have a breakthrough for the company to compete in this business area. For R&D to work on incremental or next-generation products in this area of relative investment opportunities is typically a waste of time and money.
In the upper left quadrant “supporting offense long-range R&D” is the most appropriate strategy. Another way to say this is “this is where next-generation R&D should be funded”. This is the area wherein a company enjoys large market share and wishes to maintain this position. There is no reason for a company in this environment to take on the risk of breakthrough R&D, but by the same token it cannot rest on its laurels doing only incremental work.
In the lower left quadrant were the growth rate in the industry is low (typically associated with its maturity), and market share is high, then since the company has a leading position, strong incremental R&D is rewarded. In mature markets, customers and product managers within a company both know what’s needed next. It is mature and won’t support a business return for next-generation or breakthrough efforts. The approach when in this quadrant is to do work only if needed, and that’s especially true in areas where the market growth rate for the industry is low. An important element to remember is that in this environment, the intellectual property usually generating the most value for the corporation is a trademark or brand names and not patents.
In the upper portion of the lower right quadrant defensive R&D that is incremental should be continuously conducted to maintain market share position. Here a company could be in real danger of losing market share because the growth rate is still high enough to attract competition or aggressive behavior from large competitors. As a smaller player in the industry, competing by offering slightly better features sooner than the larger competition is a good strategy. As such incremental R&D should be supported to deliver products of this nature.
In the lower half of the lower right quadrant the words are to ‘Withhold R&D”. This approach is because in this area one has both a very low growth rate and market share. The wisest choice in this area is likely to withdraw from the business. If the business is a successful “cash cow” the company is probably living off of their brand, service and/or customer intimacy. They are not likely to be holding this position by means of innovative new products. Such is the logic for withholding all R&D.
Remember that these are guidelines. The lines drawn through the matrix are indefinite and use of this “R&D Strategy related to Relative Investment Opportunity” figure requires business wisdom from an entire management team comprised of technical, marketing, sales, and general manager to make the best choice.

The next matrix has to do with appropriate new business development strategies. The matrix helps determine a best path forward. The 3 x 3 grid of the “Strategies For Corporate New Business Development” figure has on the vertical axis market factors and on the horizontal axis technology factors.
Base market factors are those that are embedded by way of business practices, branding, and product features into products and services of the business segment under study. New-Familiar market factors are those that are new in this specific business area of the company but they’re familiar in the sense that there exist adjacent or tangential markets that are offering similar products and services using similar business models. The top column has to do with New-Unfamiliar market factors. This is where the factors are both new to this market and also unavailable elsewhere in the world from other markets. This environment requires creating a new business model for which there is no precedent. Projects with this attribute are offering a new product feature into a market for which there is no documented precedent.
The technologies definitions are much of the same ilk. Base technologies are those that are known and well used within the industry. New-Familiar are those which are related to or used in other tangential industries but not yet used by the company at present. New-Unfamiliar is of course technologies that are unknown both to the corporation and to the world at large.
The guidance provided by this matrix focuses on where the technology can be created or accessed with the highest business probability of success. In the left and lower part of the matrix internal development is favored. This is because the company is likely to have both the market and technical knowledge/competence within the company capable of creating the new product or feature being sought. It will be faster to “just do it yourself” than to spend the time looking for outside help. As one moves to New-Familiar columns and rows it makes more sense to start looking outside. On the technology side this help is typically accessed via a license and on the marketing side it is typically a business acquisition. For the New-Unfamiliar rows and columns it is time to look outside and leverage the company’s resources via University joint-ventures, other company joint-ventures or strategic alliances. These approaches carry the most risk because the technology or business partnership relationships typically under-perform due to cultural differences between the entities. Clearly the far upper right and top areas are the most risky in this regard so many entities utilize venture capital funds to lead the developmental efforts, and then if those are successful, acquire the business only after the concepts from a technical or market standpoint have been shown to be sound.

Another way is assessing the environment is to look at the technology portfolio from the standpoint of Importance versus Position. This is shown in the “Technology Portfolio Imperatives” figure.
This particular matrix can be used either early on or late in the portfolio planning process. It’s a check to see how much the project should be resourced (going into a strategic planning exercise or at the end of a portfolio selection process to determine whether the project will be resourced in a way that will generate business success). The technology importance on the vertical scale has to do with the technology content of the offering. The technology content is rated high when there is a very unique product function that can be achieved through a specific technology, and this product function is highly sought after by customers/consumers. Contrasting on the horizontal axis is the company’s relative technology position. It’s strong when a company has good scientists and engineers who understand and have protected the technology with intellectual property. It is weak where in a company does not have the people with the background and experience to deliver a technical solution in a timely manner. As will be discussed more in the human resource section, company scientists and engineers should be rated on their ability to create incremental, next-generation, or breakthrough work. There are times when breakthroughs are needed and yet when one looks critically at the staff, a big risk is being taken in assuming that that particular group of individuals has a high likelihood of generating a differentiated result.
From the “Technology Portfolio Imperatives” figure the upper right-hand box environment recommends a strategy to invest heavily to succeed or get out of the business. A half-hearted approach is the least effective. In the upper left-hand box it’s more of a defensive mode. From an organizational standpoint the upper right requires more breakthrough efforts whereas the upper left is looking for more of a strong next-generation offering. Along the bottom part of the matrix the recommendation is to cut back and used resources in other places or drop the efforts altogether.
Experience shows that in mature industries marketing and product management individuals are typically looking for technical change, and the Desirability Functions related to those changes shows the importance of making the changes is going to be minimal with respect to changing market share and profitability of the corporation. When such is the case were the technology importance is low, it’s better to use resources in a way that will generate higher returns for the corporation. This is especially true where a company also has a weak relative technology position. Putting the time and energy into building personnel’s skill base and then use it on a project for which there would be marginal return makes little sense.
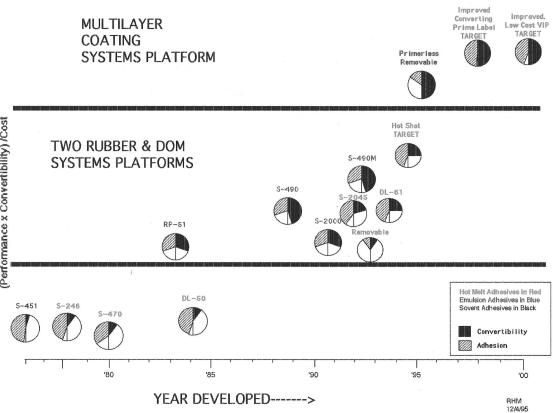
These foregoing examples have looked at how different technology strategies and approaches are aligned with the environment surrounding the company. They are however a bit high-level. It is also useful to look more closely at technologies specific product functionality in detail. For example, the “Step change in Performance and Convertibility/Cost” figure shows the first of such visualizations. This example shows how pressure sensitive adhesives attributes (Performance and Convertibility/Cost ) have changed over time and reflects systems rather than just an adhesive based approach. Graphs such as this are often the best way to visualize technology changes over time. The x-axis is year developed or commercialized and the y-axis is some form of performance or product functionality.
In this case the bubbles are divided into two halves. The left half reflects the view of performance, and the right half shows convertibility. White areas of the pie show consumer desired needs that are yet unfilled. Over time there is a drift towards more and more of the consumer attributes being filled and the performance increasing as a function of cost. The reason such graphs are powerful is that there are times when new projects are proposed in which the performance is actually staying flat or decreasing rather than increasing over time. Charts such as this quickly spot that type of trend.

One of the most powerful ways to show a technology’s attractiveness is to look at relative cost of one technology versus other technologies on the x-axis versus relative performance of one technology versus the others on a vertical axis. An example of this is shown in the “Value Map of Relative Performance versus Relative Cost” figure. This first example is fairly simple showing the relationship in cost and performance going from low-end office label adhesives, to those that are used in marketing and promotions, to those further up the ladder used in tapes and labels for structural applications. Later in this book this performance versus cost graph is also used for evaluating markets, technologies and intellectual property. In fact when all three are shown on the same graph we will see that it will be a very powerful visual tool.
The “Value Map of Relative Performance versus Relative Cost” figure shows how project work in one area can impact favorably or unfavorably work in another area. It highlights potential overlap in projects (typically a problem in larger, multi-divisional corporations). Of importance here are the arrows representing technical project improvements being undertaken for various business lines. In this example they show different pressure sensitive label adhesive projects being undertaken in one application can create an adhesive with such improved performance that it can be used in another market segment. This illustrates for upper management how next-generation products in one area can also become a next-generation or breakthrough adhesive in another marketing area as well. In the example shown one can see how the solvent-based adhesive label “oak” will end up being useful not only marketing and promotion films but also for interior and exterior mounting tapes. The performance versus cost matrix makes it readily apparent that there will be a significant improvement in performance and cost for interior mounting and a cost reduction for external mounting tape alternatives. Since humans remember pictures much better than words, graphs such as this capture the strategic direction and next-generation environments in decision-makers minds as they undertake portfolio selection.

Building upon the same concept of relative performance versus relative cost is an example having to do with microwave technology that was available in the early 1990s. This is shown in the “Performance versus Cost of Microwave Technologies” figure. The x-axis in this example is relative cost and the vertical axis plots relative performance of four general areas of technology: magnetic / electric, coatings, foils, and metallized films.
Instructive in this example is the fact that metallized films are a better cost performance alternative than any of the other options available. Metallized films can be produced at a lower cost than electromagnetic applications or organic materials used as coatings. Metallized films have the same cost as laminating foils but offer much superior performance especially with respect to arc resistance that can occur sometimes when microwave materials are heated for long periods of time. When constructing such charts it’s often useful to color code them by major competitor or by type the technology being undertaken. Again looking at the external environment through this frame of reference allows strategic planning with the right bias (towards technologies that will bring the most value).

The focus of the above material is heavily on matrices. Many senior management teams look at business this way, but as an alternative oftentimes visual pictures such as trees can convey the same understanding in a more vivid manner. The “An Example Technology Market Bonsai” figure is such an example. In this case it is a tree that has the generic technologies of the corporation as roots supporting the markets and products growth shown as branches and leaves.
This example works particularly well when multiple technologies are required to generate any single product for a company (usually true in large multinationals). Here basic chemicals, processing technology, packaging technology, software, and distribution technologies are all combined to create products that serve various industry segments and markets. Especially in times when cost cutting becomes a driving force for a corporation, senior management is looking for ways to understand why it is that basic technologies in so many different areas should receive continued support. Trees such as this help them understand the interactive nature of the generic technology and differentiated capabilities technologies to create product functionality that serves many different product lines. Trying to do this with a ball and stick diagram (in a one-to-one map) oftentimes creates nothing other than confusion. But showing it is a living object such as a tree or bush oftentimes creates a feeling in senior management how it is that the technologies come together and then disperse to generate products. This results in support for an organization’s technical, marketing, manufacturing, and intellectual property functions.
In summary, it’s important to review the environment before embarking on a strategic planning process. Above are but a few examples of ways to visualize the situation. It’s important for companies’ strategic planning teams undertaking this process to look at each of these options quickly by spending just a few minutes mapping out what each visual display might look like (with their current level of understanding) just to see whether the resulting picture is likely to add value and insight. Too often what is found is that companies get wedded to a particular picture, or develop a particular picture in more detail, that doesn’t really add true value to the planning process. This stalls out their process rather than adding the insight they’re looking for. The 80/20 rule can’t be overstressed. It’s important to put 20% of the effort into these visualizations to produce 80% of the value. It really doesn’t matter if a particular point is exactly where it should be, it’s just the correct overall pattern that has value.
Technology Strategy via Reviewing the Projects
The next step in the technology strategic planning process is to review the projects. One of the most important elements at this point is to divide projects into three categories: These are those projects in which the technology changes are incremental, those in which the technology changes are next generation, and those projects in which the technology changes are breakthrough. One of the common mistakes made in many corporations is to throw all projects into a single mix. Separating the process into three pathways at this point speeds the decision process and improves its quality.
Incremental
Starting first with selecting incremental projects, this is best done with strong input from customers or clients. Incremental projects are those that require very little change in the technology and very little change in a consumer use of the product or service. They’re also projects for which both the technical and the product manager understand almost instinctively what needs to be done. The fastest and best way to rank these types of projects is to simply make a table what shows who is the sponsor, for what customer type (see below), and then estimate to return on the investment (ROI) made in the project. Most sales organizations have classified their customers into A, B, and C lists, or by whether they are devil or Angel customers, or more numeric ranking based on profitability per customer. Those customers that generate the most value for the corporation have their voice weighed the most. Typically a combined team of technical, sales, and marketing personnel can easily rank order the list of incremental projects by customer type and ROI.
Next-Generation
Next-generation project priority is not only more complicated but it’s worthy of extra attention to detail because it’s the kind of project that most corporations face. In spite of the desire of many corporations to have breakthrough projects, truth of the matter is that the most solid business growth is often generated by next-generation research and development programs. Breakthrough projects are often best undertaken by firms being supported with venture capital money rather than by ongoing operations profits.
Setting the priority of next-generation projects involves evaluating projects on multiple attributes that fall under four main areas of evaluation. The first main area deals with the degree of strategic fit between the project and the corporation’s business interests. The second main area often involves assessment on multiple scales related to the business returns to the corporation when the project is successful. The third main area in which projects are evaluated is the degree of risk that the company is undertaking by moving forward with the project. The fourth main area that projects are typically evaluated on includes the company’s capability to do the project internally vs. externally and the company’s ability to knowledgeably license technology at an appropriate price point.
The purpose of using anchored scales for each of these attributes is to allow consistent evaluation by multiple individuals across various projects. In addition easy-to-use scoring and visualization tools allow the strategic planning team to make unbiased comparisons of projects and project ideas, as well as providing a means to communicate the strengths and weaknesses of the portfolio mix more effectively to fellow team members, to professional colleagues, and top management. In the following example each project and project concept utilize “star maps” as a visual communication tool to show eighteen project attributes, defined in three categories for each project (the main return and risk areas are combined into an “attractiveness” area), so that the strengths and weaknesses of the individual projects are identified.
Values plotted on Star maps are created for each attribute (under each of the three categories), by looking at the list of descriptions for that attribute, then choosing a numeric value representing the closest fit of the description to the attribute based on the team member’s knowledge of the project or project concept. These descriptions are referred to as anchored scales so that inputs from multiple individuals will more closely agree.
The Star map itself can be generated in Microsoft Excel. The star map is a spider chart (360°) plot where the numeric value assigned to each attribute is plotted.
Comparing Next-Generation Projects
Typical elements used to compare next-generation projects follow. For each attribute a set of anchored scales is also given. The first area is strategic fit:
I. STRATEGIC FIT
Division Strategic Plan Fit
5 = Essential To Division’s Strategic Plan: This is a major project for the division and the project’s success is critical to the division’s success five years out. The project is written into the division’s strategic and operating plans and is identified as one of the top 5 projects for this division. 4 =In Division’s Strategic Plan: The project is written into the division’s strategic plans and is identified as a future project for this division. 3 = Supported By A Divisional Group: The project has been orally discussed and supported by two or more Division functional group managers as important to the division. It could be in the division’s functional group strategic plans. 2 = Discussed By Divisional Head: The project has been orally discussed by a division functional group or head who would like to champion the project. 1 = Not In Division’s Strategic Plan: No functional manager is supportive of this program.
Corporation Strategic Plan Fit
5 = Essential To Corporation’s Strategic Plan: This is a major project for the Corporation and the program’s success is critical to the Corporation’s success five years out. The program is openly discussed in executive council presentations. 4 = In Corporate Strategic Plan: The project is discussed in executive council as a project important for the Corporation. Most top executives are supportive of the project. 3 = Supported By Corporate-Level Group: The project has been orally discussed and supported by 2 or more Executives as important to the Corporation. Other executives may not find value in the program. 2 = Discussed By A Corporate-Level Head: The project is championed by a Corporate-level functional head who would like to see the project commercial. 1 = Not In Corporate Strategic Plan: No Corporate-level support for this program. (Note however that a division may find that this project is essential to its strategic plan).
Time To Commercialization (Competitive Horizon)
We give a higher numeric value to those projects that will be commercialized faster as they will have more impact in a shorter period of time; longer term projects may have a greater impact but there is more uncertainty in the outcome
5 = 1 year until first commercialization of technology. 4 = 2 years until first commercialization of technology. 3 = 3 years until first commercialization of technology
2 = 4 years until first commercialization of technology. 1 = 5 years to commercialization
Technology Position (Intellectual Property Fit)
5 = Dominant: We are four years ahead of our competition in developing this technology and we will be able to patent the technology worldwide. 4 = Strong: We are one year ahead of our competition in developing this technology and we may or may not be able to patent the technology worldwide, but we will be able to patent the technology in the U.S. and a few other countries. 3 = Competitive/Pacing: We will be able to patent the technology only in the U.S. or in Europe. We will be blocked by other patents or prior art from broad filings. 2 = Weak: We are behind the competition in developing this technology and we will have to commercialize around other patents. We will have no, or just a niche, patent ourselves. 1 = Poor: We are behind the competition in developing this technology and we will not be able to commercialize without a license.
Product Base (risk)
The degree of risk (technical, financial, market) generally increases from Core to Breakthrough programs. Since there is a greater risk associated with being successful in developing a breakthrough product, we give a lower numeric value to this description.
5 = Core: Core businesses include the current growth and cash-cow divisions of the company. The Corporation has an interest in sustaining the business fueled by existing products by keeping up with new advances and new technologies to improve the profitability and market share associated with these businesses. 4 = Geographic Sector Expansion: New platforms are based on technology programs related to bringing derivatives of core business products into new geographic sectors. 3 = Market Sector Expansion: New platforms are based on technology programs related to bringing derivatives of our core businesses into a new market sector. 2 = New Platform: New platforms are based on new-to-the-company technologies that will change cost or product functionality by over 20% and allow market share change of over 10% in businesses which are related to our core business interests. 1 = Breakthrough: This technology will allow the Corporation to reach new customers and distinguish itself from the competitors by introducing “new to the world” technology which was unanticipated, unique and industry changing.
II. ATTRACTIVENESS
Reward Potential (Sales in year five)
We use this attribute to categorize the total sales associated with the project five years after the project technology has been commercialized by the Corporation. We assign a quantitative number to the sales figure to allow us to evaluate the impact of the project on the Corporation. The number used for each category is industry dependent. Projects which do not have sales that are expected to reach this number in year five are looked at with closer scrutiny. Projects which fall under the low number are nonetheless put into the portfolio if such a project supports a division which has small sales but high economic value (EVA).
5 = High (> $50MM). 4 = Strong ($40MM< X < $50 MM) 3 = Medium ($20MM < X< $40MM) 2 = Low ($10MM < X< $20MM) 1 = No sales (Below the waterline, < $10MM) Profit Potential (margin of base business)
ROS%
The numeric value assigned to each category is industry or organization dependent. Numeric values are typically based on the CFO’s expectations for profit margins for the divisions with the strongest to weakest financial performance.
5 = greater than 20% 4 = 15%to 20% 3= 10%to 15% 2 = 5% to 10% 1= less than 5%
Performance/Cost Matrix Position Versus Nearest Competitor.
This attribute looks at the products which will come out of the project. The team member is asked to stand back, take a look into a crystal ball and try to critically compare the future product(s) versus what the nearest competitor is expected to be offering the market at that time of introduction of our product. The two areas that looked at for each level are: Performance and cost-to-produce/market.
5= better performance, lower cost. 4 = better performance, higher cost. 3 = equal performance, lower cost. 2 = lower performance, lower cost. 1 = lower performance, higher cost
Overall Market Growth Rate
This attribute is used to take a look at the market growth rate in the next five years for the anticipated products/process improvements that will come from the project.
5 = High: Market growth rate above 20% 4 = Medium: Market growth rate between 8% and 20% 3 = Low: Market growth rate between 4% and 8% 2 = None: Market growth rate between 0 and 4%% 1 = Negative: Market growth rate is below 0%
Life Cycle Position for Business Market Targeted
This attribute is used to take a look at the current maturity of the industry to be serviced by the proposed project’s products/services. Some of the issues that arise here are focused on whether the company should invest in a business that is declining or harvest what financial profits they can and then exit.
5 = Growth: Industry/business presents ample opportunities for new products, financial reward. Market growth rate over 2O% 4 = Growth, reaching maturity: Past inflection point of growth curve. Industry/business presents ample opportunities for new products, financial rewards. Market growth rate between 5% and 20% 3 = Mature: This business will continue to be profitable and investment should be made. Market growth rate between 0% to 5% 2 = Mature, beginning decline: This business will continue to be profitable and investment should be made. Market growth rate below 0% 1 = Declining: This market is in decline; this business should be harvested to extract financial profits and then exited. Market growth rate is below -3%
Environmental Impact Relative to Current Business Practice
5 = Positive: The new products/process improvements will be environmentally friendly. 4 = Significant: The new products/process improvements will have at least two environmentally friendly components. 3 = Some: The new products/process improvements will have at least one environmentally friendly component which is an improvement over existing products/process improvements. 2 = Neutral: The new products/process improvements will have the same environmental impact as existing products/process improvements. 1= Adverse: The new products/process improvements will be less environmentally friendly than existing products/process improvements.
III. CAPABILITY
This included items such as Customer Contacts, Sales Strength, Logistics Systems
Segment Share of The Company Vs. Its Largest Competitor.
The current market segment share for a particular market serviced by the Corporation and its nearest competitor are analyzed to see if: (1) the company has a segment share that is 1.5 times larger than the nearest competitor, (2) if the company has nearly equal share in the market or (3) if the company has significantly less of a market share than the nearest competitor.
5 = High (greater than 2.0 times) 4 = Large (between 1.2 and 2.0 times) 3 = Medium (between 0.8 and 1.2 times) 2 = Low (between 0.2 and 0.8 times) 1 = None (less than 0.2 times)
Market Knowledge
This attribute checks the Corporate knowledge of the market where the planned launch of the new product/process improvement is to take place.
5 = Core: We know this market well. Our marketing people are on a first name basis with the top 20% of market segment customers. 4 = Player: We are a player in this market. Our marketing people are on a first name basis with one or two of the top customers in this market segment. 3 = New but familiar: We haven’t sold products in this market before, but it is similar to other markets we have entered in the past. The marketing people know how to plan a product introduction. 2 = New, but know where to go for help: We haven’t sold products in this market before, but the marketing people know who to contact in order to plan a product introduction. 1 = Unfamiliar: This is a new market for the company with new rules and new players. Our marketing people are starting from scratch.
Technical Knowledge.
This attribute checks the Corporate knowledge of the technology related to the project concept.
5 = Core: We have corporate resources/experts familiar with this technology. We can quickly layout a solid research and development program. 4 = Player: We are a player in this market. We have one or two experts in this field. They can layout a solid research and development program after a quick refresher from the literature and personal contacts. 3 = New but familiar: We haven’t worked in this area before, but we have corporate resources or experts that have knowledge in a related field of science and this knowledge can be used as a foundation block. 2 = New, but know where to go for help: We haven’t done work in this area before, but the technical people know who to contact to plan a research and development program. 1 = Unfamiliar: We don’t have any technical knowledge developed in the corporation in this field of science or applied technology. We don’t have any immediate appropriate external contacts.
Correct Division Personnel Involved
5= Have full and appropriate resourcing by the division slated to commercialize the project: We have the right individual identified and assigned as the project champion in the division for which the project is targeted, the individual has agreed to be the project champion, other necessary resources are assigned to the project. 4= Have appropriate resourcing by the division slated to commercialize the project: We have the right individual identified and assigned as the project champion in the division for which the project is targeted, the individual has agreed to be the project champion, not all other necessary resources have been assigned to the project. 3 = Have some resourcing by the division slated to commercialize the project: We have the right individual identified and assigned as the project champion in the division for which the project is targeted, the individual has agreed to be the project champion. Other necessary resources have not been assigned to the project. 2 = Have divisional people signed up: We have an individual identified as the project champion in the division for which the project is targeted but the individual is not the best person to be the project champion. 1 = Have no commitment within divisions: We have not been able to identify a division champion, or get current or future resources identified.
Availability of Personnel (functional completeness of team)
Do we currently have the resources in house to do the project?
5 = Full resources are present: We are 100% resourced to run this project today. A cross-functional, cross-organizational team is in place. 4 = Almost all resources are present: We are 90% resourced to run this project today. A cross-functional, cross-organizational team is in place. One or two key functions or organizations are missing as active team members. 3 = Most resources are present: We are 80% resourced; we are missing one or two functions on our desired team, all other team functions will be filled by resources currently available in the Corporation. 2 = Some resources are present: We are less than 50% resourced; we are missing more than two functions on our desired team, half the other team functions are filled by resources currently available in the Corporation. 1 = Don’t have the needed resources: We have less than 20% of the human capital resources identified as critical to the success of the project; we will need to look outside of the Corporation for these resources.
Availability of Personnel (time until available)
This attribute is used to identify when the needed resources will be available to work on this particular project.
5 = resources available now: 95% to 100% of the resources are available now. 4 =resources available now: 80% to 95% of the resources are available now. 3 = resources available to work in 6 months. 95% to 100% of the resources are available in 6 months’ time. 2 = resources available to work in 6 months. 80% to 95% of the resources are available in 6 months’ time. 1 = resources not available for 1year. 80 to 100% of the resources are not available for one year or more.
Forecast Probability Of Commercial Success (Risk)
We use this attribute to measure the “betting-person’s” feel for commercialization of the idea/product.
5 =High: The betting-person would believe that this project has an 85% to 100% chance of successful commercialization. 4 = Good: The betting-person would believe that this project has a 60% to 85% chance of successful commercialization. 3 = Medium: The betting-person would believe that this project has a 40% to 60% chance of successful commercialization. 2 = So-So: The betting-person would believe that this project has a 15% to 40% chance of successful commercialization. 1= Low: The betting-person would believe that this project has a 0% to 15% chance of successful commercialization.
Project Completion Index
On-going projects are evaluated at the same time as new project concepts to ensure the on-going projects are still on the right track. This attribute is used to measure how much progress the project has made towards commercial success.
5 = In scale-up: Stage-Gate stage 4 4 = In development: Stage-Gate stage 3 3 = In feasibility: Stage-Gate stage 2 2 = In preliminary assessment: Stage-Gate stage 1 1= In idea: Stage-Gate stage 0
Project Velocity Index
On-going projects are evaluated at the same time as new project concepts to ensure the on-going projects are still on the right track. This attribute is used to measure how fast the project is moving towards commercial success.
5 = Less than 4 months average per stage . 4 = Between 4 months and 6 months average per stage. 3 = Between 6 months and 9 months average per stage. 2 = Between 9 months and 12 months average per stage. 1= More than 12 months average per stage
Graphic display of the above attributes can now be used to support the project selection process. This is done by constructing a visual image using Microsoft Excel or an equivalent program. The image is so constructed is shown in the “Star Map and Attributes” figure.

Each of the anchored scales is shown radiating from the center. The score for each attribute is marked as either being 1, 2, 3, 4 or 5. This particular graphic shape was developed by Betty White at California State University Long Beach. She found that the human eye and mind are very quick to process images that have filled and whitespace patterns. In the example shown one can see there is a high degree of commercial fit, a few holes in the technology position and return, as well as having capability gaps which would need to be filled to make the project successful.

This concept has been carried further by building out even more the number of axes to deal with the rewards, risks, and capabilities. Such an example is shown in the “Star Map and Attributes Detail” figure.

In the example shown there are some elements of risk in the lower left quadrant that need to be addressed and there will be some technical backfilling required to make the project successful. A better view of the attributes being analyzed as shown in the “Extended Star Map and Attributes” figure.


Anchored scales and attributes can be modified to align with any company’s needs and environment. Additional example attributes and their anchored scales are shown in the “Additional Anchored Scales for Fit and Attractiveness” figure and the “Additional Anchored Scales for Risk and Capability” figure.
It is also important to note that anchored scales need to be filled out not by a single person but by a team of people. The team should have a cross functional viewpoint. Marketing, technical, and business backgrounds are important to ensure that the answer is as unbiased and enlightened as possible. A common mistake to make in picking project teams is to pick those people who have hierarchical seniority within a company. What is better is to pick people who really have the best knowledge of the field and can best evaluate the projects. Often times this means gatekeepers, research fellows, senior sales people who are outside the traditional management structure. What is required is utilizing all those that have the needed background and experience to make the best evaluation of each attribute.
The above sections use visual displays to reflect information. It should also be noted that when they’re just a few projects to evaluate a management team can just look at them and determine the best fit for the corporation. There is no need to make something complicated that can be done simply.

For some individuals looking at so many anchored scales and star diagrams can be confusing rather than simplifying. Yet, because of the problems with using only a single project rating score, something in-between these two extremes was found to work best. Thus some companies have modified the Excel spreadsheets underpinning the star maps to create a simpler looking summary visualization. The intermediate step is shown schematically in the “Star Map Attributes Summarized For Strategic Fit, Attractiveness, And Competitive Position” figure.
The individual arm scores are then summarized in the areas of strategic fit, attractiveness and competitive position. Such summary value for each of these three areas allows the project worth to be projected a distorted triangle.

The advantage of the “R& D Project Action Based on Triangle Shape” figure graphic display is that after management teams are trained in looking at this visualization, they can see by the shape of the triangles what the appropriate R&D course of action should be.
If in the “R& D Project Action Based on Triangle Shape” figure an equal lateral triangle is present, then the best course of action would be to diversify the technology and spit it out is because it’s strong on all attributes. When the competitive position is weak yet strategic fit and attractiveness is good, it’s OK for a company to go ahead and invest in the technology either with its own resources or with a partner, but the technology has to create a significant consumer desired feature or the project should not be funded. Conversely if it’s the attractiveness axis that is weak yet strategic fit and competitive position look good the best thing to do is to re-target the project into markets where higher returns can be obtained, or kill the project.
Another approach is to pick projects to create a single combined score for each project and then rank order projects by this combined score. This is done by taking each anchored scale value and multiplying it by an attribute’s weighting factor to get a score for each attribute. These individual attribute scores are then subsequently summed with all other attributes scores to give an overall project value. Management teams can then evaluate projects based on those with the highest scores.
As mentioned before, Betty White at California State University Long Beach found however that it teams actually made better decisions if they could see the patterns rather than numerical sums. Buried in the patterns were nuances as to why one project might have hidden features or attributes that would make it a better bet for corporation over a project that might have a slightly higher numeric score. It is for this reason that several methods are mentioned in this section.
In choosing the best visual display of information it’s important to try several different approaches with a company’s management team and then use the one that provides the fastest, highest-quality, and stickiest decisions. There really is no one right answer. It depends upon the Meyers Briggs types of the senior management team. Since most executive teams are relatively small it’s appropriate and time effective to match decision-making style to executive team makeup.
Technology Strategy via Reviewing the Project Mix

The classic method for evaluating and selecting next-generation products is to look at risk versus reward. The risk is often put in terms of technical difficulty whereas a reward is usually defined as net present value given success. The classic 2 by 2 matrix is shown in the “Technical Difficulty and Commercial Potential” figure.
Reaching an appropriate balance of risk and return involves a trade-off between technical difficulties and commercial potential. Projects with a high probability of success and a low-return-given-success are usually associated with incremental next-generation projects. These are usually what a corporation considers to be the bread and butter or cash-cows of its business and the focus of much of the development teams’ efforts. White elephants below them are ones for which the probability of success as well as the return is going to be low. One hopes that by doing thoughtful strategic project planning to avoid projects falling in this quadrant. The oysters are those with high net present value but low probability of success. They’re called oysters because not all of them have a pearl in them, but if the technology development does come through with a next-generation or breakthrough product, the return is handsome indeed. Last are projects labeled as pearls. These frankly rarely exist because these projects have a high probability of success and also a high return. When they are found they typically consist of (1) systems which are comprised of known components or (2) are projects that take existing technology into new markets (where consumers are ready to purchase). In this model the suggested project distribution is 80/20 between “Bread and Butter” and “Oyster” projects. “White Elephant” and “Pearl” projects are only rarely undertaken.
A slightly more complex product portfolio plan was proposed by Rick Brown. Here instead of using the traditional 2 x 2 matrix of attractiveness versus capability he used a 3 x 3 matrix because it better segments out the pearls, oysters and bread-and-butter projects described above. He believes there are Six Zones.
Zone one has high market attractiveness and high company capability or probability of success. The goal here is to build volume. The strategy is to expand the market by converting non-users or increasing usage rate. Another alternative is to grain market share by winning competitors’ customers.
Zone two has a moderate to low market attractiveness but high company capability. The strategy here is to hold what the firm already has. This takes the form of defending share by maintaining customer value, maintaining communications presence or brand, and continuing product improvement. It’s about defending margins, reducing costs, reducing investment intensity, and vertical integration.
Zone three has moderate market attractiveness but weak company capability. The strategy here really depends upon competitive analysis: (1) If the market leader is weak, slow or passive, a good strategy is to challenge the leader by investing selectively or by an acquisition. (2) If the leader is strong, responsive or aggressive, and you’re a follower, it is just best to accept the number two status that you have. (3) If your company holds a niche position, it’s to best to specialize further, and focus on unmet consumer needs.
Zone four is characterized by moderate to weak market attractiveness and moderate to weak capability. The strategy here is to harvest. Harvesting can either be done slowly by reducing discretionary expenditures, improving the sales mix, or rationalizing distribution channels. Rapid harvesting involves eliminating discretionary expenditures altogether and raising prices.
Zone 5 and Zone six are really quite unattractive. Zone 5 possesses an unattractive market and weak company capability. The option here is pretty much to terminate the business. This can be done either by liquidation or divestiture.
Going beyond these methods, a portfolio selection usually involves many more matrices as outlined in third-generation R&D discussed above. These matrices have the advantage that they help an organization see which projects are likely to be better than others at producing value for the company in the time frame that it needs. The disadvantage is that by using multiple matrices sometimes a strategic planning team and also senior management loses sight of the “forest” because of its focus on the “trees”. That said, these project methodologies have been proven through the decades to pick projects by corporations in all industries with good success.

The best set of matrices to use when picking R&D project portfolios will now be reviewed. They are typically generated and used for decision-making in the order given. The primary method of picking project priority is shown in the “Primary Project Priority Matrix” figure.
This figure is a traditional risk versus reward matrix. The difference is that it is somewhat quantified. The probability of commercial success is shown on the x axis. Most organizations define this as the multiple of technical success times market success. The y-axis is the reward potential after some time period elapses since the new product is introduced. When projects are mapped on this matrix is clear that the upper right-hand corner is the most desirable (high probability of commercial success and high return to the corporation). This matrix is done first because the results of this matrix typically trump any of the others that follow.

For next-generation products the second project priority setting mechanism is to think about how sustainable the advantage is that RD creates. This will be of value to the corporation as shown in the “Secondary Project Priority Matrix” figure.
This attribute is shown in the vertical access from weak, to strong, to dominant. The cut off points are how long the company will enjoy an exclusive position because of its intellectual property. The first cut-off point is usually a year; the second cut-off is four years. These can be adjusted to match the appropriate life cycle times of the products or services the corporation offers. The x-axis is stated in technical terms. The leftmost column is for incremental R&D. The center column is new platform and new products which is usually next-generation R&D. The right column typically accesses new customers and is achieved through breakthrough R&D. One of the reasons for using this matrix is that it is not uncommon for general managers and marketing managers in mature businesses to fret over declining returns to their businesses, therefore requesting breakthrough projects. When one looks carefully at what the breakthrough would achieve by way of product functionality it is clear that many times it can be reverse engineered, or that the cycle time associated with the with the project would be such that only a weak technology position would be achieved. This is often because such general managers and marketing directors discuss their ideas and concepts with others outside the company. Such disclosure ruins the opportunity for an intellectual property position. As such, projects like this end up in the lower right-hand quadrant. When that happens the best thing to do is abandon such efforts. This matrix, when used in this manner, can be a training tool for such marketing people and general managers.
The priority running across the top row of this matrix is from a stakeholder’s point of view. The first priority is actually to the left rather than to the right. At first glance this may seem counterintuitive. However we think of it as an investor one would always give preference to products which have a high chance of being successful (that is the incremental ones) over those that are more risky but a big breakthrough. Remember that in this case both projects will create a dominant commercial position on launch. Of course the counterclaim to this is that it’s very difficult to get incremental projects done in a way that creates an intellectual property position capable of excluding others for over four years. Such a feat is rarely obtained. However there are times when acquisition of technology outside the corporation can be brought to market. In this case it could then be incremental R&D yet because of a previously established IP position be a dominant technology and commercial position.

The next element when selecting R&D projects is the way in which the project is postured. Posture here is defined as either offensive R&D, defensive R&D, withholding R&D, or a maverick R&D approach. The way in which such choices are made is shown in the “Posture of R&D Projects” figure.
The x-axis in this matrix relates to the relative market share of the company versus that of the next largest competitor. This work was developed by Bain Company. The x-axis runs from being very dominant versus the next largest competitor by holding a two or even three times market share size compared to them. This might be the case of 3M in the area of Post-it notes. Something where the market shares are roughly equivalent might be for instance between Coca-Cola and Pepsi Cola and the soft drink area. Low market shares, typically that of less than 10%, occurs when start-up companies are trying to take new share with a new business model. The vertical axis is created by thinking about the overall market growth rate. This ranges from high-growth products such as consumer games, medium growth telecommunications products such as cell phones, and negative growth products which may be for instance found in commodity grade steel or metals mining. So for example if we take Frito-Lay with a high market share and a medium overall growth rate we see that they should be working on defensive R&D. This is typically incremental R&D designed to keep the company’s share large versus the next largest competitor. In these cases usually brand strength and intellectual property through copyrights and trademarks is more important than that from technology and patents. As such the incremental R&D defensive posture is appropriate. To spend any more would achieve very little because market share is already so large. The effort is only increased when there’s a strong attack from another company.
Offensive R&D is required even at high shares. An example is with Internet companies in the late 1990s, and computer gaming companies in the 2000s. The market is moving so fast that a company must continually reinvent itself and stay tuned to the changing customer and market needs. Here next-generation R&D needs to be funded and it needs to be funded in a consistent constant manner. Even companies that only have a little over one times the market share of their competitors need to have this offensive stance.
The upper right-hand quadrant where there is low market share and high-growth is usually populated by startup companies entering a new market. Here Maverick or Breakthrough R&D is imperative. Again a common flaw in large-company portfolio selection is to think that the company can enter a new market that has a high growth rate by doing next-generation or incremental R&D. This flawed thinking usually comes from an inexperienced product manager or marketing person believing that they’ve identified a consumer feature that can easily be put in place. This may be true, but in high-growth areas lots of companies are going to have that same insight and without a breakthrough approach the companies will remain at a low relative share position. This usually results in poor profitability.
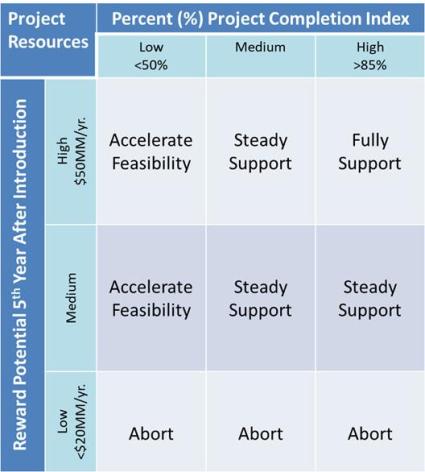
Having picked projects using the first two priorities, and then thinking about the way they are postured, the use of a third matrix leads to the next question of “how heavily to resource the project?“. Later in the integrated intellectual property management section, the IP resources required should also be taken into account. However focusing only on business and technology integration, project resources are calculated based on the company’s return versus how far along the project was. This is shown in the “Project Personnel and Capital Expense Resourcing” figure.
The vertical axis of this matrix was used previously. It is the reward potential for the corporation after product introduction. The x-axis is new. It ranges from a low project completion index between a few percent up to 50%, to a medium project completion index ranging from 50% to 85%, and to finally a high project completion index above 85%. This matrix is put in place because there are times when it is appropriate to evaluate current ongoing projects right along with those that are just entering the system using a zero-based system. This is a means to do so. All projects are put on this matrix and those that are going slowly through the stage gate process are going to show is being in the low to medium completion areas. The quadrants labeled “fully support” and “steady support” relate to staffing those projects at levels consistent with the corporation’s past history of success. “Accelerating Feasibility” is necessary when it is time to figure out whether a project is going to make it to the next gate in a stage gate process or not. “Accelerating Feasibility” often means supplying additional capital expense items, analytical research time and information science support. Putting temporary personnel on the project for a month or a quarter to see if a breakthrough can be made is also a good strategy. If this approached and extra support doesn’t generate a result, it’s time to abort.

When doing business technology management and project selection for R&D projects the question of internal or external sourcing of resources needs to also be considered. The decision matrix that is traditionally used to make these decisions is shown in the “Partnership Decision Matrix” figure.
The x-axis of the “Partnership Decision Matrix” figure has to do with market knowledge. It moves from core markets which are well understood, to those that are new but familiar to the world, to those that are unfamiliar anywhere in the world. The vertical axis is the same for technology knowledge. This knowledge ranges from core technology that the company possesses and can implement easily, to that which is new to the corporation but familiar elsewhere in the world, to that which is unfamiliar to anyone in the world. The lower left-hand quadrants (because of the competence within a corporation) recommend project teams made from members of the company’s staff. Moving to the upper right either by moving to the top or to the right moves the company into partnerships. When moving up it is technology that must be developed with outside technical leaders. Moving across the matrix suggests working with outside market leaders. The upper right quadrant is considered suicide square because it is very rarely that both a new technology and a new market can be created at the same time. If this path is undertaken it is often best to do it by way of an outside venture.
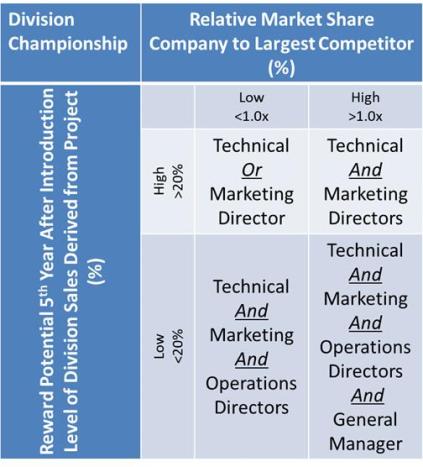
Important in large corporations is the actual champion or owner of the Project. A simple decision matrix is oftentimes helpful. The “Organizational Position of Project Champion” figure shows who the appropriate champion might be within a corporation.
In this “Organizational Position of Project Champion” figure, the x-axis is the relative market share of the company vs. that of its next largest competitor. The vertical axis segments the reward in the fifth year after product introduction. It’s expressed as a share of that division’s sales versus the raw number. Mapping projects on this matrix allows one to see whether it the project should just best be champion by a central R&D, a divisional R&D, a business unit marketing person, or business unit general manager. There are also times when working relationships allow co-championship of a project. If that is the case it is strongly recommended that the corporate culture allows it.

Within technical organizations there can be conflicts when assigning specific individuals to projects. In such cases is useful to use the matrix shown in the “Capability versus Availability” figure to help resolve such conflicts.
The vertical axis in the “Capability versus Availability” figure matrix segments the background knowledge from a technical standpoint that exists within the corporation. In the lower quadrant there really is no in-house expertise, whereas towards a top solid expertise in both a corporate lab as well as in the business unit exists. The x-axis range segments the world’s availability of knowledge (the number of sources from which a person could acquire the technology needed for R&D success). This ranges from many sources that exist in the world to technologies that are newer and unfamiliar (where there are essentially no people willing to share what they know within the world). Mapping projects on this matrix often shows R&D personnel why it is in everybody’s best interest to look outside for R&D support. This can often be used to during budgeting negotiations between senior R&D personnel and general managers. There are times when general managers try and do the work inside because they perceive that it can be done cheaper with no change in their headcount or incremental expenditures that would cause problems for a declining business. This can move the general manager’s thinking to include outside help.

How projects are done and who might be responsible for them can also be helped along by the matrix shown in the “Project Goals” figure. In this matrix the market share strategy is plotted versus the product line needs. This is different from the previous matrices because it’s focused on the strategy from a both a technical and marketing standpoint versus what the actual share is of the current company’s products.

Shown in this figure are the goals the project should have based on product line needs and marketing’s share strategy. This is a good sanity check on the project’s articulated goals, but more importantly, by overlaying on this matrix the appropriate organization to best take on the project to provide leadership adds clarity to the project leaders reporting relationship. This is shown in the “Organization Responsible for Technology Project Management” figure.
In the upper left-hand side of the “Organization Responsible for Technology Project Management” figure we see that when companies are yielding market share it is inappropriate to do any R&D. This is in contrast to the lower right-hand quadrant where the company should try to add new markets with really new products. In this area it is often important to use corporate R&D (or an outside partner if one is available) to create a breakthrough or significant next-generation product. Projects falling in-between are best done by divisions’ applications engineering, product research or applied research personnel.
Using the matrices just discussed, it is often best to make each matrix up all at the same time, and put each one on a single sheet of 8.5” x 11” paper (or alternatively drawn on a large flipchart). These are then placed on a wall (preferably in a war room to be discussed later) and observed from across the table. This allows people to look at the patterns that are being created in each of the matrices and have an open honest discussion about which technology projects are really the best ones to take forward, and which ones are best managed by which of the corporation’s organizations. Individuals conducting such an analysis are best gathered from across the organization. They should involve general management, marketing, technical, manufacturing, and intellectual-property personnel.
The power in these matrices is that many general managers are trained to look at data in tables and charts. Showing projects mapped out in such matrices are visual displays that most seasoned general managers are custom looking at. It’s often said sarcastically that most consulting firms provide everything in 2 x 2 or 3 x 3 matrices. Conducting R&D strategic planning in the same mode has its advantages in being familiar to participants.

An alternative to such methodology is to conduct the same planning by using the Star diagrams discussed earlier. In this methodology the projects that are related to incremental R&D are put together and compared against one another. Those for next-generation and breakthrough R&D are again collected and evaluated separately. The common form is to put on one very large Post-it note or 8.5” x 11” sheet of paper a single star diagram. The methodology for doing project selection using these visual displays, is to layout the Star diagrams on a table with the horizontal axis being the company’s capability (upper left quadrant of the star diagram) and the vertical axis the return to the corporation (lower right quadrant of the Star diagram). A cross functional team begins by moving projects around on the table until everyone agrees that the projects are in about the right spot. This methodology has the advantage in that it is usually quicker to do than the matrices, and in hindsight it has been found that the decision was of a higher quality. Projects selected are those for which the company has both a high capability to conduct and will generate a high reward. An idealized example of such a distribution is shown in the “Idealized Selection of Projects by A Star Map Distribution” figure.

R&D’s “Cycle time reduction” (Time to Market, Speed to Market, Time needed to commercialization) are elements not typically covered in the traditional technology and business strategies. Although it can be said that there really isn’t much point in looking at R&D cycle time because everybody wants a project yesterday, explicitly looking at R&D cycle time allows improved R&D performance. Elements of this thought process are shown in the “R&D Cycle Time Reduction” figure.
The world has come a long way with respect to cycle time reduction. Shown in Figure 3.7.61 are the old elements which isolated R&D from business. The methodologies for using technology were have R&D work on a project until it was fully developed and then “thrown over the fence to marketing and manufacturing to make and commercialize”. In the 90s the coupling between the market and the customer was occurring as well as between the business and R&D. Coupling market insight from marketing timelines versus competition allowed R&D to better plan which project should be given priority. By the mid-1990s Quality Functional Deployment (QFD), or Design for Six Sigma processes were taking R&D time into account. Road-mapping methodologies also take time into account. Clearly time forecasts can best be done with incremental projects where things are known, it is more difficult with next-generation and certainly close to impossible for breakthrough technology projects. As such Spiral Development was developed for software and Internet R&D in the late 1990s, and improved upon later with Agile and Lean Development processes in the 2000’s. Open Innovation (discussed later) promised to reduce cycle times still further in the 2000’s, along with providing access to a broader repertoire of existing technologies.
Technology Strategy via Reviewing the Project Commercialization Horizons
Another important way to look at technology strategy is to look at the timelines on which new product and service commercialization will occur. This is important because shareholders of the Corporation want to see constantly improving revenues and profits. Viewing the innovation strategy from the standpoint of when the projects will go commercial and to what extent they will create revenue and profit streams upon commercialization is key to corporate resource planning (operations, manufacturing, sales, marketing, etc.) In order to balance a portfolio to achieve this objective the company must look at how much it is investing in Horizon One (commercialization in one year or less), Horizon Two (commercialization between one and three years), and Horizon Three (commercialization between three and 10 years). Understanding which projects fall into which buckets and looking at the company’s track record for commercialization of each bucket, the target investment required can be ascertained.

In the “Portfolio Analysis Worksheet” figure all of the projects proposed for Horizon One (core products), Horizon Two (adjacent products), and Horizon Three (transformational products) are listed. Calculations are then made as to the percent of the overall portfolio is dedicated to horizon one, two, and three. Also determined are the percent of the projects within any category that are not aligned or aligned to the strategy. For unmanaged portfolios it is not uncommon to find that horizon 1 is vastly over resourced to the detriment of horizon 2 or horizon 3 work.

From the portfolio analysis worksheet the best projects and propose projects are selected and placed on the “Target Portfolio Worksheet” as shown in the figure. This worksheet is shared with top management and the organization so that everybody understands how the work being undertaken with support innovation thesis over time and that the percent of resources going to each horizon is appropriate. The corporations high-level business strategy team can also confirm that the required number of new products and services will commercialize on time to keep shareholder value increasing at the promised rate.
Technology Strategy via Fourth-generation R&D; Business Process Innovation

One of the innovations that happened in the 1990s was to make more money off of innovating upon your company’s business model that innovating further upon the company’s technology. It didn’t take long to figure out however that neither was really done in isolation. In fact the desired state was concurrent innovation on both business model and products and services. Simple model of this is shown in the “Framework for Business Model Innovation” figure.

Driving the Internet explosion in the late 1990s was the realization that business model innovation was often a method to change the productivity of mature organizations. This is shown graphically in the “The Need For How To Do Disruptive Development In Maturing Businesses” figure. Companies in traditional industry segments were looking for innovation products and services as a means to create disruptive or discontinuous change in maturing areas.
Not only was there a need in maturing business segments for new breakthroughs that would build future business, but critical conditions affecting innovation were becoming understood. The six of these critical conditions affecting innovation were: (1) acceleration of change, (2) discontinuous evolution of markets, (3) economic paradigm change, (4) appalling expectations of customers, (5) high cost of R&D., and lastly (6) failure of past R&D projects.
Change through the 1990s started coming at faster and faster rates. This was true not only technical change but also (as companies moved their businesses to the Internet) in the way they went to market. These change also affected the economic paradigm. Previously, a company’s profitability model held that it was only when the company exceeded the product’s breakeven point it started making money on the incremental sales volume. As such it was common practice to do variable pricing in tough economic conditions against the variable cost of products rather than the fixed cost of products. Sophisticated variable volume/variable cost financial models allowed companies to become ever more competitive, but they did nothing to address the underlying need for changes in the overall profitability model of an industry. With the Internet, the fixed cost of running a business dropped dramatically. There was no longer the same need for a corporate infrastructure in plant and equipment that existed in the old Bricks-and- mortar areas. This allowed profitability at much lower sales volumes. The paradigm also changed from the customer standpoint. Customers expected very high quality and most importantly immediate delivery of product. To add further stress to the innovation process, R&D had problems as well. The cost of R&D was doing nothing but going up and the probability of commercial success overall remained the same as it had for decades. Something clearly needed change.
Standing back and looking at the three stages of R&D, allowed individuals to understand what was broken. Three stages are usually considered to be (1) concept development, (2) technology development, and (3) market development. In the 1990s what was happening was that concept development usually didn’t work. The technology development for the most part did work but market development only worked sometimes. This was seen in the overall probability of commercial success. The overall metric in the 1990s for all products taken into R&D, 80% of them failed on commercialization. Many times the technology worked but the market research was insufficient to forecast consumer acceptance. This performance lead to “Fourth-Generation R&D / Innovation” with its focus on really good concept development (characterized at the time as the “fuzzy front end of innovation”). Stated is a knowledge management problem, the four critical aspects Fourth-Generation R&D / Innovation were: (1) managing knowledge assets, (2) targeting dominant designs, (3) leveraging platforms, and (4) managing the innovation process.
Managing knowledge assets for Fourth-Generation R&D / Innovation required defining the product functionality needed for new products and services with clarity. Product functionality had to be stated in the same terms that consumers would use. This deeper understanding of consumer behavior leads to uncovering new dominant designs or architectures that could deliver products or services to consumers. Only after understanding the linkage between what the consumer wanted and the way in which they needed it delivered, could the third element of Fourth-Generation R&D / Innovation really be used to leverage technology and business platforms. Initially the highest leverage was the ability to understand distribution channels and ways to satisfy unmet consumer needs. After gaining that understanding the last step in Fourth-Generation R&D / Innovation was to be able to define the processes for managing innovation as a business process. By the late 1990s this last step of managing the innovation process was fairly well understood. It was targeting the new dominant design in the second step that was the real difficulty.

In getting to the details of this Nonaka and Takeuchi when looking at a knowledge creating company talked in detail about explicit knowledge and tacit knowledge. Explicit knowledge was that which can be expressed in formal language and easily transmitted between individuals. The dominant mode of knowledge in the Western tradition is of this form. Tacit knowledge on the other hand is a personal knowledge embedded in an individual experience involving intangible factors such as personal belief, perspective, and values. The relationship between these two forms of knowledge is shown in the “Relationship between Explicit and Tacit Knowledge” figure.
This figure shows that a relationship between tacit and explicit knowledge is one of a continuous cycle. Knowledge can start in any quadrant but tends to evolve in a very specific clockwise spiral. The finding of Nonaka and Takeuchi was as it goes in a clockwise manner and not in a random pattern. They provided an example starting in the lower right-hand quadrant where people are thinking about scenarios from observations (scientific observing) and create value by making decisions. This often involves to the scientific method or problem solving process of building of prototypes to test values and scenarios. From this the processes moves to the upper left-hand quadrant where personnel engage in dialogue, testing the prototypes in field studies, and thus create user experiences. In method of scientific problem-solving is one of analyzing and observing and creating a new hypothesis which leads back to the first step in the lower right-hand quadrant. Most technical people are trained in the scientific method or problem solving, but not necessarily to think of it as a model of transferring explicit to tacit knowledge backwards and forwards. Additionally, Nonaka and Takeuchi’s understanding that market knowledge or understanding of consumer’s behavior was also best described and handled by a similar model.
Another key element of this model is the relationship between explicit knowledge and tacit knowledge with respect to both individuals and groups. For individuals it’s tacit knowledge that dominates. In fact the ratio of explicit knowledge to tacit knowledge in individuals as been estimated to be approximately 1 in 99 or 1%. This ratio can be observed in some television reality shows about adults not knowing much more than a fifth grader. Most people have a good understanding of their personal beliefs, perspectives and values and a very poor understanding of the tacit knowledge or history that exists in the world. It turns out this is a similar ratio to that found in groups. Tacit knowledge in groups that is related to culture far outweighs their explicit knowledge related to policies and procedures. A look at the behavior in organizations like the military or utility corporations which have large policies and procedures shows it is often the case that people are driven off of the culture and very rarely know what is in the handbook.

Important to managing innovation is that people typically have an intuitive feeling about the talents and knowledge required on how to do things, but very poor understanding of the explicit knowledge to do them. This is shown conceptually in the “How to Get From Knowledge to Action” figure. The wavy lines on the right-hand side of this graph talk about the performance gap between knowledge and action.

The key in the “How to Get From Knowledge to Action” figure is that most technical and market research people are trained in obtaining data and converting it through filters to information, along with combining that information with their own and group experiences and theories, to create a body of knowledge (either explicit or tacit). The trick to success in development of new products and setting of strategy is to use architectural capabilities to bridge the performance gap. These architectural capabilities are often very weak are poorly understood in most organizations. It was the elements of Fourth-Generation R&D / Innovation in planning around architectural capabilities that lead to the understanding that in addition to product development projects, there should be also be projects around understanding the overall architecture and the way in which a business system operates. Product development is tightly coupled to the architecture and capability development, which in turn is coupled very tightly to strategy development. A feedback loop of course needs to occur as well. This is shown graphically in the “Intervening Architecture And Capability Step In Strategic Plan Development” figure.

The insight of Fourth-Generation R&D / Innovation was the fact that an intervening step of architecture and capability existed between product development strategy developments. Up until that time it was just strategy driving product development and vice versa. In some ways it could be argued that the value chain analysis described previously in this book accounts for these elements. That is true, but very few individuals really realize the importance of understanding that value chain in the terms of how industries, markets, and organizations were coupled to one another. Even less so was how industries, markets, and organizations were coupled with a dominant design or method of doing business. The evolution of the dominant businesses design changes over time and people were up until the advent of Fourth-Generation R&D / Innovation were not taking such into account in strategic planning processes. Utterback put it in a graphic form shown in the “Evolution of Value Chains / Dominant Designs” figure.
Utterback was able to show that the dominant design usually starts with architectural capability. Innovation management is how a whole system of bringing a product and service to market is done. The conceptual model involves putting it into practice platform innovation, followed by specific product innovation, followed by specific process innovation. The advantages of planning and executing innovation this way will be shown further when looking at the intellectual property elements of strategic planning.
In the “Evolution of Value Chains / Dominant Designs” figure the evolution of architectural capability and platform innovation precedes product innovation. A rupture or breakthrough occurs in the dominant design when a completely new way of providing a product or service to individuals or companies occurs. Usually the rupture occurs because people are able to get to a basic core human need and satisfying it in a completely different architectural way. The reason that it may have taken until the 20th century to come up with this understanding was the fact that until the advent of the Internet the growth and the frequency of ruptures occurring in industries was not high enough for people to observe the behavior and understand what was really happening. Translating this observational capability into an organization requires such a capability within the organization. Therefore within a strategic planning group, integration of changes in consumers, technology, processes, practices and tools need to be incorporated. From a holistic strategic planning standpoint, an investment in increasing knowledge (capability) of the people within an organization has to occur. Another way to do this is of course to tap outside resources effectively. Innovation planning needs to incorporate not only new technical know-how and improvements in standard R&D practices, but also to integrate legal or intellectual property into that understanding. Processes and practices need to be understood at all three levels: global, industry segment, and company architecture. Also improved information systems and physical layout of organizations are needed.

In Fourth-Generation R&D / Innovation reassigning where the capability to identify and articulate change is developed ranges from research and development to operations. In defining such roles: (1) R&D defines the new architecture and capability overall. (2) Development defines the architecture and capability with respect to the development of specific products services and distribution platforms. (3) Operations define where new platforms can be applied to product families, products, services and distribution systems for business results. Innovation thus occurs in all three organizational roles within a corporation. The important element derived from Fourth-Generation R&D / Innovation is that one must invest much more heavily in advanced marketing intelligence than one ever has in the past. The second element in Fourth-Generation R&D / Innovation needing attention is to also incorporate the effect of intellectual property changes on technology, operations and marketing. Strategic technical planning requires thought about changes in strategy in a more integrated way. The “Forces Shaping Commercialization Strategy” figure shows some of these elements.
In this “Forces Shaping Commercialization Strategy” figure the ongoing changes in strategy need to account for changing technologies, changes in the complementary business assets, changing customers, and changing competitors. More on how to run an integrated strategic planning process taking into account all these elements will be discussed later in the book.
Up to this point the methodologies center mostly upon products in the form of physical things sold to consumers. Products also can relate to what is most traditionally called services where new service innovation is a key element. This is particularly true in computer gaming, financial services, and other virtual offerings. Robert Cooper and Ulricke de Brentani looked for similarities and differences between elements of successful strategic planning for products and services. They found the key factors separating new product winners from losers were (1) a strong understanding of users’ needs, (2) a strong focus on marketing or launch advertising promotion, (3) efficiency of development, (4) effective use of outside technology spread through internal scientific communication, and (5) seniority and authority of responsible managers.
Upon studying this further they found that there were actually eight elements that usually predicted manufactured product success in the market. These were (1) Product advantage. That is product superiority or unique benefits for users’ in product quality and value for their money. (2) Product definition. Here’s the reason for doing good strategic planning is a well-defined product and project prior to the development phase increases the chance of commercial success significantly. (3) Quality of execution of technological activities. Not surprisingly technical assessment, R&D, in-house tests and trial production done in a high-quality manner outperform projects were this was haphazard. (4) Technical synergy. There was a strong match between the needs of a project and the skill level of the personnel involved, both in technology and manufacturing environments. This has to do with the capabilities fit in the Star diagrams mentioned above. (5) Quality of execution of pre-development activities. Culinary market and technical assessments, marketing research, and business analysis all play a role in making sure the product will succeed not just out technically, but on commercial launch. (6) Marketing synergy. A strong match between the needs of the project and the firm’s sales force, distribution, advertising, promotion, and marketing skills clearly improved the probability of success. This has to do with making sure complementary business assets such as a training of the salesforce or distribution system linked to what was actually being developed. This relates to the position on the “relative cost / relative performance curve” to make sure that the new R&D product R does in fact match the capabilities of the company to market and distribute it. (7) Quality of execution of marketing activities themselves. This has to do with excellent market research, user field trial test markets, and market launch. As described above in the Fourth-Generation R&D / Innovation section, this needs to be understood with deep insight. (8) market attractiveness. Clearly large, high need, growth markets are much more attractive than ones that are not. The margin for error in growing markets is also much larger so the probability of commercial success in these environments clearly better too.

Cooper also found that the probability of success with respect to financial service products was found to be eleven in number. The comparison between the success factors as shown in the “Comparison of Success Factors for Products Versus Services” figure.
The number one factor in predicting the success of new service offerings is synergy. There needs to be a fit between the needs of the product and the resources, skills and experiences of the company. Areas were synergy must exist is between the company’s existing service delivery system, the firm’s expertise in human resource capabilities, the behind the scenes production operation’s facilities, the management skills and preferences, marketing research capabilities and resources, the company sales and promotional capabilities and resources, and the company’s financial resources. Said another way and drawing upon Knowledge Based Organization benchmarking conducted by the Industrial Research Institute showed that companies that forgot about the capabilities of a sales organization (in being able to market a new product) oftentimes lead commercial failure even though technical success was achieved. Doing strategic planning and taking into these elements is clearly important. When quantitative benchmarking was done, projects that had high levels of synergy were successful 85% of the time whereas lack of synergy resulted in failures 79% of the time. The latter statistic mimics the traditional product failure rate of only 20% of products succeed upon market introduction when the technical success was achieved.
The second factor in predicting the success of new service offerings is the degree of product and market fit. Is important that the service meets customer needs and wants. More specifically, satisfying customer needs means responding to important changes in existing customer values and operating systems. Said another way the first factor in success looks at a company’s capabilities, whereas this second factor makes sure that when one looks through the e4yes of the customer that same degree of fit is present.
The third factor in predicting the success of new service offerings is the execution quality of the commercial launch. The advent of Internet-based companies clearly shows this to be the case. Companies with poor user interfaces stumble badly. Having a quality launch means that: (1) the service has been fully tested prior to launch, (2) that there are no bugs in the product, (3) that the lunch program plan was highly detailed and well documented, (4) that service personnel have received extensive training and are ready for any questions that arise from customers. This means that in large companies a formal promotional program has been designed, implemented and tested via internal marketing, and (5) that the service has the well promoted to front-line personnel so they know the true features and benefits of the new offering.
The fourth factor in offering services versus products is how critical it is to be a unique and superior product. In some ways this is the same as what is true for a manufactured product but the degree of commercial success depends even more on having clearly unique and superior benefits to users, providing better value than previously available services, having superior service outcomes than competitors, offering higher quality, delivering faster, being more efficient to use, being more reliable and having a higher-quality image.
The fifth factor was that the quality of execution of marketing activities was also important. To some extent a strong market orientation reflects the same factor for product innovation, but there are also other ingredients. Many services require consistent definitions, user friendly website design, and similar user experience on web and mobile applications. This needs to be consistent with what was detailed in the in-depth market study and product launch documents.
These five elements were the dominant ones in making sure that a new service offering would have impact. The six secondary factors were important but not as important as the first five. These are in order: (1) Having a service expertise in the company. For example, having skilled people in both the frontlines as wells in operations and production areas. Also important were (2) market size and growth, (3) the quality of execution of the technical activities, (4) the quality and execution of pre-development activities (formal ideas screening / concept testing with customers financial analysis), and (5) market research and use of the drawing board approach. The quality of the actual service delivery was found to be important. A high-quality delivery created a new service advantage of 1.5 times as successful as those that had a so-so perceived quality of service delivery performance. The last factor is present in both service and product offerings.
More important in service offerings is that there is tangible evidence of past success. For most products, people can pick the product up, look at it, determine whether they want it or not, and understand what they are getting for their money. Services on the other hand are much harder to describe. There is no way to look before you buy. Therefore references and other tangible evidence that helps enhance or makes visible to customers the service quality tends to create more successful products.
In the Star diagram methodology described above, modifying the major axis and decision matrices with the factors important to service offerings is one way to make the decision process robust for multiple projects. Making such modifications is straightforward but critically important if the company’s future growth is dependent on services.
Research on strategic planning for technology and service offerings was also conducted and reported by Bruce Walters and Richard Priem. What these authors discovered was that organizations that were focused on being different from competitors and achieved higher performance from differentiation tended in their strategic planning to pay more attention to the external environment and less to the internal environment. In contrast those organizations that were focused on being cost leaders in their field paid more attention to the internal environment within their organization and less attention to the external environment.
Technology Strategy via Business Model Canvas
Another approach to strategic planning is to develop an Innovation Thesis. The process to do so consists of seven steps utilizing 10 to 12 top executives within the business for a two day workshop. This must include all the top decision-makers across operations, finance, marketing, heads of business units, and the CEO.

The first step in the process is a Pre-Workshop. In a half-day preview workshop the company’s main business model is mapped. If the company has more than one business model several models are mapped and then convergence is done on the main business model the company uses. The point of the workshop is not to map business models on a product-by-product basis but rather to map the general approach the company takes in doing business in its core markets. Osterwalder’s “Business Model Canvas” as shown in the figure is used.

The second step is to Conduct Research. At the end of the workshop the executives are given copies of the Business Environment Canvas as shown in the Figure. They are then given 2 to 3 weeks to work with their teams to do the research necessary to be able to complete the categories on the “Business Environment Canvas”, e.g. key trends. They are also encouraged to make a first pass a completing the environment canvas with their teams.
Step three is a Workshop. After the research period, the team reconvenes and the key trends, market forces, industry forces and macroeconomic forces impacting the Corporation’s business model are collaboratively mapped.
The fourth step is a Review. After mapping the business environment the executives review their initial business model in terms of how adaptive it is to the business environment they have mapped. The point of the task is to identify key gaps and potential problem areas. The identified gaps articulated and captured in a separate document.
The fifth step is Laying Out Options. After identifying gaps, the executives consider how these gaps may be dealt with. The goal of this exercise is to create innovation options. These can range from changes to their current business model, introducing new products into adjacent markets, and coming up with transformational ideas. The point is not for the executives to come up with specific product or service ideas. Instead their role is to identify the types of ideas, markets, industries and arenas in which they would like innovation to happen. In other words they will be defining how they expect innovation to help with the gaps and challenges identified in step four.

Step six is to Develop a Thesis. After deciding how to use innovation to help with closing the gaps in the Corporation’s portfolio, the group of executives works on their innovation thesis. First they complete the “Innovation Thesis Worksheet” as shown in the figure. After reviewing examples of investment theses from various venture capital firms, the executives work on their thesis making sure to provide a clear strategic narrative about how the world is changing, how they expect these innovation to benefit her take advantage of these changes, and specifics about the types of ideas and teams they will invest in. Also articulated is what the Corporation will not invest in. This Thesis Statement becomes the guiding document that the corporation’s technical and business development groups can use for guidance.

Step seven is to Iterate. After the team completes the first drafts of the innovation thesis, the executives then share the thesis with their teams, get feedback and iterate on the thesis. The final versions of the thesis are then shared with the rest of the company as a “Thesis Statement”. Product ideation then takes place in the arenas, ideas, technologies, markets, business models, and teams areas.
This is a much higher level plan than the previous strategic planning processes create. On the other hand its benefit is it builds an innovation ecosystem. This helps protect management from disruptive innovation emerging from the low-end or emerging markets. The company must resist at all costs it’s a natural reaction to walkway from apparent low profit margins and revenues. An established company should as much as possible try and disrupt itself.

When the projects are generated from the Thesis Statement, a good way to map them is shown in the “Company 10 Year Road Map” figure. In this particular Figure, Facebook started by building an ecosystem, that led to developing products, and finally into investing in technologies that it needed to support its growth. Other corporations start with technologies, then go into products and then finally build ecosystems. There is not one right way to evolve, but the pathway should be visible and understood by all so collaborative discussions and improvements to the plans can be made.
Technology Strategy by Participatory Funding
Although not so much a strategic planning method, using equity crowdfunding such as Kickstarter is an interesting way to select projects. This involves having consumers or key stakeholders “put their money where their mouth is”. It’s an alternative way to quickly determine if new business ideas are viable. It makes the statement “any good business can get funded” true with a relatively quick and easy test. The approach is possible because the U.S. JOBS Act affords any company the opportunity to sell debt or equity securities directly to investors. The U.S. JOBS Act also opens the door for smaller companies to reach investors. For larger companies, it’s a way to test consumer interest in a new idea. An alternative approach being used by companies such as Hallmark Cards is to set up pop-up stores at farmers markets or street fairs to determine directly consumer’s level of interest and project priority. This methodology is obviously best suited for consumer products, not business-to-business products or services.
Technology Strategic Planning Summary
In closing this section on technology strategic planning one can ask is we did in the beginning is it really worth the trouble. This was studied by the Industrial Research Institute’s Research-On-Research Committee’s Subcommittee. This group studying technology and business integration checked for the dimensions for achieving alignment of the company’s technology portfolio to its business strategy. What they found was that looking at strategic planning from 10 different dimensions was critical to success. These are not dimensions of the plan itself but rather the organizations’ processes for carrying out strategic planning.
The first dimension was the size and nature of future business goals broken down by markets. What they found was it was important that the business and technology expectations of future market opportunities (size, growth, new technologies and new applications) were reflected in technology portfolio. They also found that business and technology personnel jointly plan the portfolio using ongoing validated and documented forecasting of markets.
The second dimension they found important was that people were careful with their use of time. Here the critical question was do the business and technology personnel agree on a realistic timeline that with create market success. It was found that timelines needed to be created by a validated rigorous process and mutually agreed upon between business and technology personnel everyone was committed to meet well-defined objectives.
The third dimension related to the return on existing assets. The key question was whether the return on existing assets was improved by the technology portfolio. This requires inputs from people in technology, manufacturing, and marketing who possess knowledge of core technical competencies, manufacturing equipment, working capital, intellectual property, brand-name, and information technology. Important to account for in the strategic plan were changes in all asset classes during the strategic planning process.
The fourth dimension was the investment in new assets. The same considerations as mentioned for the return on existing assets apply. It is also important to document whether this investment is consistent with the future needs of the business. The technology portfolio should meet or exceed corporate standards for ROI. Not surprisingly this is easiest done for incremental projects, more difficult for next-generation, and extremely difficult for breakthrough innovation programs. This is the logic for breaking the three types of assets apart by project type or technology for planning purposes and review by senior management.
The fifth dimension was to make sure the portfolio was aligned with a balance of business objectives. This comes back to the comment about incremental, next-generation, and breakthrough technology development. The question is: does the business and technology have an integrated plan for the balance of line extension, new products, and exploratory products vis-à-vis products and service system solutions. Important is that the business has a written plan which fully delineates the intended balance of line extensions versus new products versus exploratory or breakthrough products concepts. The technology strategic plan and portfolio has to be planned and funded to be consistent with the overall strategic document. Benchmarking in large US corporations consistently showed that the overall strategic plan required to bring next-generation and breakthrough technology to market underfunded the longer term projects. Oftentimes it was incremental projects that were getting the lion’s share of funding in mature businesses. This can lead to nothing but failure.
The sixth dimension was the “new sales ratio” goal. It’s important that a corporation’s business units have defined goals for sales of new products as a percentage of total sales. The technology portfolio has to be planned and funded so it produces results and sustainable long term viability. The technology portfolio usually contained a weakness with underfunding of technology groups and therefore the demise of the corporation’s performance. It was found that the business had to have written goals aligned with strategic intent for the sales of new products as a percentage of its total sales. Failure to plan for this led to uncertain internal expectations and an inability to communicate wisely with external market analysts whose recommendations affect company stock performance. It is a challenge but the technology portfolio has to created and funded to produce business results and sustainable long term business performance.
Within this dimension is the need to create new business or market areas versus existing business areas. This weighs heavily on the fourth-generation R&D planning concept described above. A company has to determine which new business verses technology areas it wants to participate in. It has to establish the value proposition for each new business area and think carefully about the architectural design of what that new business will look like. Found important in the benchmarking studies was that a company has to define the new business areas it wants to participate in first, then it has to establish adequately resourced key business and technical competencies needed to become a player in that new area.
The seventh dimension of success was to balance work in very new and improved products with that work associated with cost reduction. In times of economic turmoil it is not surprising that many executive teams look to R&D to focus on reduction of costs as a way to reduce their business risk and improve financial performance versus taking on new products and service offerings. Key to successful technology strategic planning is that the company has to have both specific goals to reduce costs by certain amount each year and to have a percentage of sales from new products and services integrated into its business plans. A clear technology strategic plan should be well integrated with the business plan to achieve both the cost reduction and the increase in new products and services offerings.
The eighth dimension of success was alignment with the business’ risk tolerance. This element is commonly addressed in the risk versus reward matrix described in the technology strategic plan above. However when one looks at it at the technology portfolio the question is: Is that portfolio match the risk tolerance of the business? Again benchmarking at the Industrial Research Institute often showed that the technology portfolio took on a risk adjusted performance larger than what the corporation actually had a tolerance for. This is because a few key in executives wanted to take the chance that R&D could generate a significant return where the general managers, being more tightly relate to the operations of the corporation, wanted a more conservative portfolio overall. This is often seen in the tension between a CEO and COO of the corporation. The CEO wants to take the higher risk and reward associated with innovative new products and services, where as a COO is always an individual usually more focused on oh less risky approach to improving operations. Where the CEO and COO of a corporation are not perfectly aligned it is very difficult to come up with an appropriate technology strategic plan.
The last dimension in looking at technology strategic planning is the organizational commitment to the plan. The key question is to think about the goals and reward system of the individuals involved in strategic planning. Often they really don’t drive technology and business integration as an outcome. They do not possess shared goals and objectives. Ideally there is agreement between technology and business management on what constitutes success in developing and executing the technology portfolio. When success is achieved all contributors share in the rewards.
Sources, References and Selected Bibliographic Information
1. “The Corporate Start-Up”, by Tendayi Viki, Dan Toma, and Esther Gons, Vakmedianet, 2017
2. “Business Model Generation”, by A. Osterwalder and Y. Pigneur, Wiley, 2010.
3. “Making Innovation Work in Your Corporate Context”, by Gary Pisano and Jim Euchner, Research Technology Management, April 2019.
4. “Innovation Portfolio Architecture”, by Scott Mathews, Research Technology Management, December 2010.
5. “Nine New Roles for Technology Managers”, by Ian MacMillan and Rita McGrath, Research Technology Management, June 2004.
6. “Strategic Flexibility in R&D”, by Michael Raynor and Ximena Leroux, Research Technology Management, June 2004.
7. “Technology Roadmapping”, by R. Phaal and C. Farrukh, Research Technology Management, April 2004.
8. “IBM Research: Ultimate Source for New Businesses”, by Sharon Nunes, Research Technology Management, April 2004.
9. “Upgrade Your New-Product Machine”, by Dan adams and sudhir Hublikar, Research Technology Management, April 2010
10. “Valuing and Comparing Small Portfolios”, by Rick Mitchell, Francis Hunt and David Probert, Research Technology Management, April 2010
11. “Competing Against Time”, by George Stalk and Thomas Hout, The Free Press, 1990.
12. “Portfolio Management for New Products”, by R. Cooper, S. Edgett and E. Kleinschmidt, McMaster University Press, 1997.
13. “WSJ Guide to Information Graphics” by Dona Wong, Webinar, Feb. 2019.
14. “Equity Crowdfunding”, White paper by PatentAngles, Oct. 2017
15. “Do you use cyber physical systems and machine learning”, by the IRI Community Forum, Nov. 2017.
16. “Strategic Planning Value to a Management Team”, by Brooke Aker, Competitive Intelligence Magazine volume 9 number four July August, 2006.
17. “Technology leverage and business impact based on maturity “S” curve”, Research Technology Management, Sept-Oct 2004, p17.
18. “Elements of Strategic Plans”, adapted from Strategos presentation to Aurigin Corporation-Searching for Sustainable Competitive Advantage, May 1998.
19. “Strategic Intent”, by Gary Hamel and CK Prahalad, Harvard Business Review, May June 1989.
20. “Strategy as Revolution”, by Gary Hamel, London Business School, 1996.
21. “The Core Competence of the Corporation”, by CK Prahalad and Gary Hamel, Harvard Business Review, 90, #3, May June, 1990.
22. “Example of Disney Core Competencies”, Strategos, delivered to Aurigin’ s searching for sustainable competitive advantage workshop, May 27, 1998 presentation.
23. “Core Competencies Template”, Strategos, Workshop delivered to Aurigin’s searching for sustainable competitive advantage, May 27, 1998 presentation.
24. “Core Competencies Template”, Strategos, Workshop delivered to Aurigin’s searching for sustainable competitive advantage, May 27, 1998 presentation.
25. “Technology / Product Function / Market Matrix”, adapted from Pugh-Roberts and Boston Consulting Group, circa 1970.
26. “Four Phases of QFD Analysis”, adapted from Avery Dennison materials, circa 1995.
27. “Relating Customer Requirements to Benefits via Desirability Functions”, adapted from Avery Dennison materials, circa 1997.
28. “Process of Creating a Technology Roadmap Plan”, by Richard Albright and Thomas Kappel, Research Technology Management, March-April 2003.
29. “Example Experience Curve”, Roadmapping in the Corporation, by Richard Albright and Thomas Kappel, Research Technology Management, March-April 2003.
30. “Starting-Up Road-mapping Fast”, by Robert Phall, Claire Farrukh, Rick Mitchell and David Probert, Research Technology Management March-April 2003.
31. “Generic Technology Roadmap”, Starting-up Roadmapping fast, by Robert Phaal and David Probert, Research Technology Management, March April 2003.
32. “Linked Technology – Product Features/function and Market Drivers-Product Features/function Grids”, Starting-up Roadmapping fast, by Robert Phaal, David Probert, Research Technology Management, March April 2003.
33. “Example Cell Phone Technology Roadmap”, Roadmapping in the Corporation, by Richard Albright and Thomas Kappel, Research Technology Management March April 2003.
34. “Example Automotive Radio Technology Roadmap” adapted from PWC materials, by Stephen Rowe, circa 1993.
35. “Simplified Technology Roadmap Example of Pressure Sensitive Adhesive Release Technology”, circa 1995, Avery Dennison Corporation.
36. “Simplified Technology Roadmap Example of Electric Heaters from Conductive Polymer Materials”, circa 1984, Raychem Corporation.
37. “Relating a Product Technology Matrix to Technology Roadmaps”, adapted from PWC materials, by Stephen Rowe, circa 1999.
38. “Example Process to Create Technology Roadmaps”, Starting-up Road-mapping fast, by Robert Phaal and David Probert, Research Technology Management, March-April 2003.
39. “Example Process for Technology Roadmapping”, adapted from PWC materials, by Stephen Rowe, circa 1999.
40. “Real Options”, by Martha Amram and Nalin Kulatilaka, Harvard Business School Press, 1999.
41. “Third-Generation R& D, Managing The Link To Corporate Strategy”, by Philip Roussel, Kamal Saad and Tamara Ericsson, Harvard Business School Press, 1991.
42. “Types of Innovation”, by the Monitor Group, Harvard Business Review, May 2012.
43. “Risk vs. Reward Matrix Variant and Associated Distribution of Returns” at http://i0.wp.com/www.straligence.com/wp-content/uploads/2012/08/Straligence_20120825.png
44. “35 Capabilities and Processes Required of Projects in Technology Strategies” at http://i1.wp.com/www.straligence.com/wp-content/uploads/2012/08/Straligence_20120825_Organizing-for-innovation.png
36. “Primary Project Priority Matrix”, by Rick Brown, Long-Range Planning, February 1991, page 102 to 110.
37. “Fourth Generation R&D: Managing Knowledge, Technology, and Innovation”, by William L. Miller and Langdon Morris, Wiley, 1999.
38. “The Knowledge-Creating Company: How Japanese Companies Create the Dynamics of Innovation”, by Ikujiro Nonaka and Hirotaka Takeuchi, Oxford University Press ,1995.
39. “Mastering the Dynamics of Innovation”, by James M. Utterback, Harvard Business Review Press, 1996.
40. “Service Strategies” by Robert Cooper and Ulricke de Brentani, Journal of Product Innovation Management 1991, page 75.
41. “Business strategy and CEO intelligence acquisition” by Bruce Walters and Richard Priem, journal Competitive Intelligence, Volume 10, Issue 2, 2nd Quarter 1999, Pages 15–22.
42. “Improving Manufacturing Competitiveness Through Strategic Analysis” by Turnbull, Fisher et al. in the 1992 NAE Report Manufacturing Systems: Foundations of World-Class Practice (available online at the NAE website).
43. “Third Generation R&D”, by Philip Roussel, Kamal Saad, Tamara Erickson, Harvard Business School Press, 1991.
You must be logged in to post a comment.