Basic Principle #3 is to Invest in and Reallocate Investment Assets Consistent with Key Financial Growth & Risk Factors
First, Understand the Difference Between “Investing” versus “Trading”
Trading and investing both involve seeking profit in the stock market, but they pursue that goal in different ways.
Traders focus on a stock’s technical factors rather than a company’s long-term prospects. What matters to traders is which direction the stock will move next and how the trader can profit from that move[i]. Traders jump in and out of stocks within weeks, days, even minutes, with the aim of short-term profits. They do this because they often take advantage of sporadic mispricing in the market. So-called scalp traders might be in a position for just minutes. Day traders are focused on the trading day, while swing traders invest for days or weeks. Once the temporary mispricing is corrected, a trader will move on to find the next temporary mispricing.
Investors focus on an assets’ potential long-term growth or value. Investors have a longer-term outlook. They think in terms of years and often hold stocks through the market’s ups and downs.
So, there are typically 5 key differences between investing and trading[ii]. They are:
- Period: Trading is a method of holding stocks for a short period of time. It could be for a week or more often a day! A Trader holds stocks until the anticipated short-term market price changes. In contrast, Investors invest their money for years, decades or for even longer period. Investing is an approach that works on more of a buy and hold principle.
- Capital Growth: Traders look at the price movement of stocks in the market. If the price goes higher, traders may sell the stocks. Capital growth is achieved by skillfully timing the market, Investing creates capital growth by compounding interest and dividend over the years by holding quality stocks in the market.
- Risk: Undoubtedly, both trading and investing imply risk on your capital. However, trading comparatively involves higher risk and higher potential returns as price fluctuations can be quite volatile. Investing involves comparatively lower risk and lower returns in a short run but might deliver higher returns by compounding interests and dividends if held for a longer period.
- Art Vs. Skill: Traders are skilled, technical individuals who time the market and learn market trends to hit higher profits in the stipulated time. Good Traders understand the psychology of the market. Investors on the other hand, analyze the stocks they want to invest in. Investing also includes learning business fundamentals and a commitment to stay invested for a longer term. Good Investors understand the philosophy that runs businesses.
- Insight into market timing/momentum vs. insight into company/market fundamentals: Traders look at other investors buy/sell momentum to capture short term market mispricing. Investors keep themselves away from the trends and invest in underlying long-term cycles and value. They invest based on a company’s management team. They patiently wait till the stock reaches its potential.
So, should you trade or invest? My thought is that trading is a full-time job… or at least a significant part-time job. If that is the job you want, trading is for you. On the other hand, since I have been fortunate to have a career working at jobs doing things that I enjoy, when it comes to financial planning, I found that I enjoy being an investor, not a trader, just because of the time involved. I also found that the times when I have tried to invest based on market timing, i.e., trading, I found those trading techniques I have used are only advantaged for short periods of time. This is because when a trading technique becomes popular it no longer works, as everybody is using the same system. In the 1960s when I was in college, I was fortunate to have access to one of the first large-scale main-frame computers. I wrote and bootlegged on that computer some financial charting based programs that allowed me to invest in the market based on weekly momentum in stock prices. This trading partially paid my way through college. By the time I graduated however the large brokerage firms had also invested in the big computers of the time, and the market timing method that I had worked on was no longer generating a trading profit. In the 1980s I was able to work with a gentleman who developed the market timing tool, based on the data that was then available on money flowing in and out of bonds and stocks. Again, that method worked very well for three years before others found it. Then, that timing method had no edge and its returns were reduced to zero. In the late-1990s I worked with a colleague who was using the then evolving social media platforms on the internet to gain an edge on which stocks were going to move up and down in the next minute or so of trading. The method got about a three second advantage over the market and it was able to do well for about six months, until others developed similar systems and had computers sitting next to the major stock exchanges that could allow them to trade in millisecond time frames. Our method was again wiped out. As you can see, I keep an eye out for trading techniques, but my experience has been that I personally do much better, with the same or less time and amount of energy, with an Investor’s approach, I do research to understand the underpinning of an attractive asset, and then buying those that I think hold long-term potential and for which I do not need to be checking on weekly, daily or by the second. That said, I try and use some of the techniques of traders when it comes to knowing when is the right time to acquire and sell my major investment positions.
Impact: For small, individual investors with a job, “constant dollar investing over a period of time” is more suitable than trading, because trading involves a near constant monitoring of the stocks/assets in which one is trading[iii].
Second, Understand How Key Factors Affect a Financial Asset’s Risk Adjusted Growth

Factors that affect a financial assets risk adjusted growth are varied. The ones most used to guide investing behavior are shown in the Table. These will now be discussed one-by-one. It is critical to understand these factors to maximize your assets growth and minimize your losses.
Impact: Even though “investing” versus “trading,” in order to obtain 7% after inflation returns for Bucket #3, you still must make time and learn how to reallocate your assets to provide yourself the best returns.
Third, Utilize “Investing” Guidelines to Maximize Your Financial Portfolio’s Risk Adjusted Growth by Reallocating Investments at the Right Times
To maximize a Financial Portfolio’s Risk Adjusted Growth it is strongly recommended to diversify the holdings of a portfolio both by the asset’s classes (i.e., stocks, bonds, real estate) and (2) the specific assets held in each class (i.e., which specific company stocks or ETFs being held). The overall bucket methodology does a good “first-cut” of diversifying a portfolio at a high level, but it must be tweaked by the following three Guidelines to achieve the needed performance.
Investing Guideline #1: Asset Allocation and Reallocation/Rebalancing Should Be Done Consistent with a Country’s Wealth & Power Position – Important for Bucket #2 & #3

BACKGROUND: At the world scale and over periods of centuries one wants to invest in assets where growth has a geographic underpinning. Ray Dalio looks at the wealth and power of nations vis-à-vis one another[iv]. In the “Relative Wealth and Power of Nations” figure, the USA is currently waning and China is increasing. Others are a mix. Countries that are increasing in their wealth and power will be better places to invest than those that are not.
In the figure note the x-axis timeframe is in centuries, so this is a very long-term pattern. Even though the USA is waning, it will take many decades before it is a relatively unattractive place to invest. On the other hand, China is a growing financial opportunity even though in the near term it suffers the many risks of a rapidly growing economy, i.e., how their government can maintain a stable business and social environment.
Impact: Investing in USA based assets will be appropriate for the next half century. When the financial markets in China become more regulated, stable, and accessible, assets therein will be appropriate to invest in. This will apply first to Bucket #3 investments, followed later by Bucket #2 investments.
Investing Guideline #2: Asset Allocation and Reallocation/Rebalancing Should be Done Consistent with the Four Turnings, Long Term Debt, SocioEconomic and Population Cycles – Important for Bucket #2 & #3
BACKGROUND: The Long-Term Debt and Fourth Turning Cycles[v] occur usually once in a lifetime. The Four Turnings theory uses the pattern in historical generations which revolve around generational events called turnings. The turnings are: “The High,” “The Awakening,” “The Unraveling” and “The Crisis.” The details are well covered in the reference, but suffice it to say that several key points can be derived from this societal behavior and should be used in financial plans and investment assets. For a quick overview of how these Turnings have occurred over the past centuries, see the “Four Turning Cycles” figure.

The Four Turnings Cycle is important for financial planning as it drives how people live their life and manage their finances, i.e., expectations on income vs. expenses, assets vs. liabilities. Since each turning lasts about 20–22 years, the Four Turnings Cycle makes a full cycle about every 80 to 90 years. These cycles correspond to the long-term debt cycle Ray Dalio researched.
Generational changes described in the Four Turning Cycle drives the cycle of Turnings, and determines its periodicity. As each generation ages into the next life phase (and a new social role) society’s mood and behavior fundamentally changes, giving rise to a new Turning. Therefore, a symbiotic relationship exists between historical events and generational personas. Historical events shape generations in childhood and young adulthood; then, as parents and leaders in midlife and old age, generations in turn shape history[vi].
Thus, back to financial planning, the long-term debt cycle is caused by the cumulative effects of people’s view of the world and from a practical standpoint, taking on more debt (credit) than they (or society) have income to support. Examples are Government’s policies like being on/or coming off a Gold Standard, or building long term Government debt over many decades. The long-term debt cycle makes its large downward reset transition during each Crisis Generation. It is a human, societal and government policy problem. The amount of debt to income is called the debt burden. When the ratio over long periods of time gets to a point that the amount of interest on the debt is more than people, or governments, can raise in income or credit, they go into a downward Long Term Debt Cycle, shown in the “Long Term Cycle (Turnings)” figure. This typically causes a major adjustment as so much debt must be paid back or forgiven (bankruptcy or currency revaluation).

Society’s economic position within the cycle can be found by looking for the key indicators shown in the graphic “Long Term Cycle Indicators”.[vii] From these indicators the early 2020’s are in the Decline or Crisis” portion of the cycle.

More specifically to reallocation of investment types, since the Fourth Turning (Crisis) typically involves a financial downturn or war that lasts about a decade, it presents challenges and opportunities for investors different from the other three Turnings. Investors must change their strategies significantly to guard against asset losses in this timeframe. Assets gains in the other Turning timeframes, “The High”, “The Awakening”, “The Unraveling”, come from more common and accepted investing strategies.
Impact: The typical bucket #3 allocation is heavily weighted to stocks during the “The High”, “The Awakening”, and “The Unraveling” parts of the cycle.
However, during the Fourth Turning, or when the Long-Term debt cycle peaks, the allocation between various asset classes becomes quite skewed and needs attention. This is because during “Crisis” periods the Government becomes unusually active and unstable. These are periods of over-extended government financing, economic support to the populace, devaluations of currencies, debt forgiveness, etc.
Impact: The typical bucket #3 allocation is weighted to asset classes such as 20% stocks/ 20%bonds/ 20%gold/ 20%real estate/ 20%cash portfolio when entering and during “Crisis” periods.

In addition to the Four Turnings and Long-Term Debt Cycles are US specific institutional and socioeconomic cycles described by George Friedman[viii]. They have global importance, however, because the US is so large and influential. Examining US history since independence, Friedman observed two repeating patterns: an 80-year institutional cycle and a 50-year socioeconomic cycle. Each cycle peaked with a defining crisis, and we are approaching a point in which both waves will crest at about the same time.
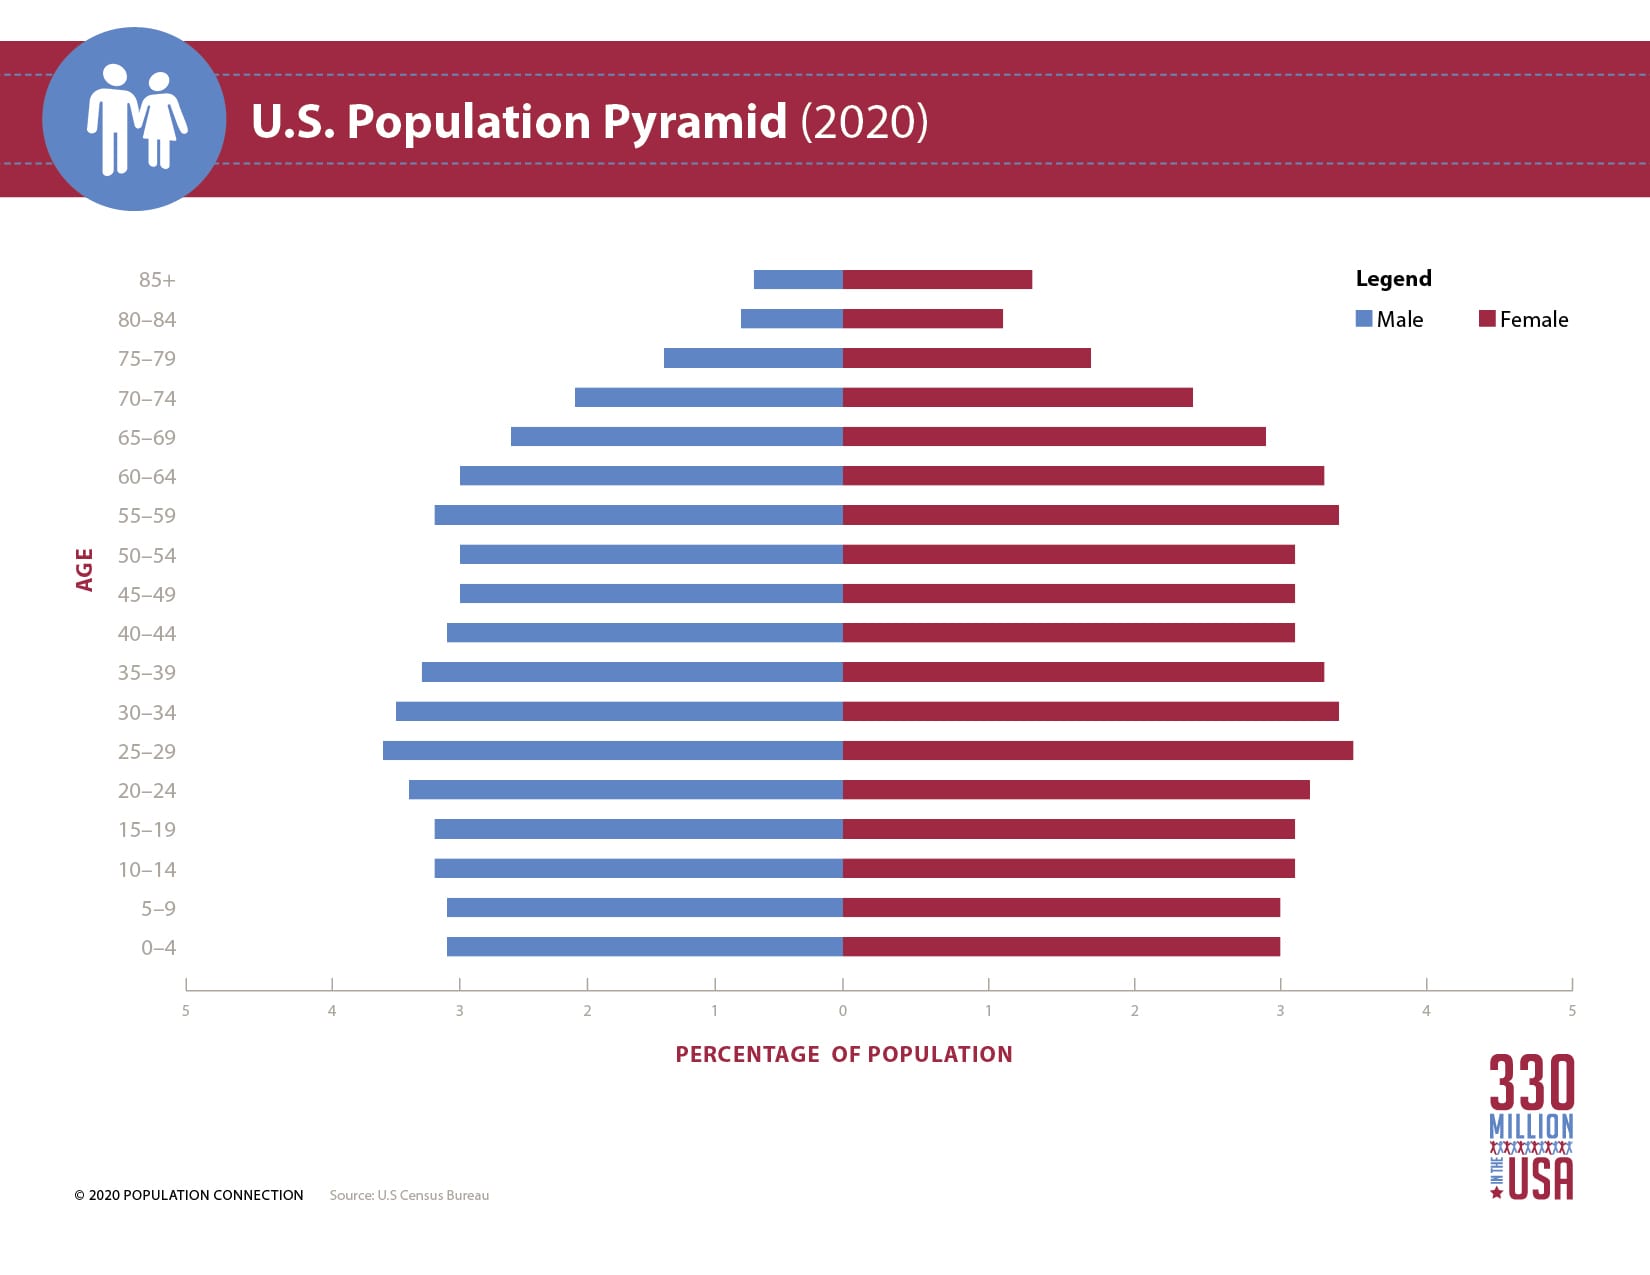
Related loosely to the Four Turnings, Long-Term Debt, Socio-Economic Cycles is the population cycle. Big decade long bursts and busts in population growth affect long term consumer purchasing trends. Thus, when large numbers of investors are participating in similar investment vehicles, they provide an economic undercurrent of long-term demand (increasing prices) or lull (decreasing prices). The US Population Pyramid figure[ix] (as of 2020) for instance shows a bubble of early 30’s cohort (1% change = 30million people) entering the time of life when purchasing a home and raising children will boost those sectors of the economy, and thus the relative earnings of those asset classes.

Impact: Typical Bucket #2 assets that you will hold for several decades or more, i.e., real estate, partnerships, etc., should be acquired, when possible, consistent with the Four Turnings, Long-Term Debt, Socio-Economic, and Population Age Cycles. The best time to purchase these assets is just as the “Crisis” period is ending and just before a bulging age cohort enters the market (i.e., real estate purchases usually start when an individual is in their 30’s).
Investing Guideline #3: Asset Allocation and Reallocation/Rebalancing Should be Done Consistent with a Country’s Inflation and Economic Activity Indicators – Important for Bucket #1, #2 & #3
BACKGROUND: The next level of detail to think about when investing is at the country scale. Financial asset allocation and reallocation / rebalancing should be done as the country’s macroscopic economic conditions change.
To do this, Ray Dalio[x] asserts that superimposed on the above long-term Turnings or Debt cycle, shown in the “Long-Term Cycle (Turnings) figure” above, are two other macro trends that affect investing.

First, he feels that overall these long-term cycles actually have an upward slope, versus being level, because as humanity learns more, individuals and companies become more productive. This is shown in the “Productivity (Technology)” figure.
Second, we have shorter-term cycles (ups and downs) around the long-term debt cycles, caused primarily by Government actions that drive actual economic activity up and down. Examples are FED policies that are reactionary retrospective changes to the financial system based on national employment and inflation levels. These actions cause cycles that are approximately 10 years in duration, as shown in the “Short-Term Cycles (Government)” figure.

Combining all three of these curves into one curve gives rise to the final “Combined Dalio Curve” that investors see and experience. Knowing this curve shape and its repetition frequency provide insight on when and how to allocate, reallocate, and rebalance investment assets.
This overall upward moving corkscrew plot is what will help us determine which general classes of assets to invest in at any point in time. Dalio believes that the reason people typically misinterpret the big moments of change in life is that we each experience only a part of the Combined Dalio Curves in our adult Investing lifetimes.

Dalio’s curves lay the foundation for the best model to use when investing. This is the Gavekal Four Quadrants framework[xi] for linking the macro environment to the investment landscape. Note that the normal short-term trend over time circles around and around these quadrants, leading to the Dalio short term debt cycle curves. Note also that this matrix recommends holdings that include both Bucket #2 and #3 type assets.

The key finding from the Gavekal framework is that within any country’s environment it is important to look at both economic activity and price inflation rate when determining which asset class to invest in. It is also important to note that economies move through these four quadrants in cycle times from a few to a half-dozen years. This makes the timeframe for re-balancing investment portfolios on a monthly basis a good idea. From approximately 1990 to 2020, the world has basically alternated between disinflationary booms and busts, which make inherent sense as the dominant force of capitalism is deflation. This is because every entrepreneur, everywhere around the world, is always trying to produce more with less (being more productive).
To use the Gavekal framework to rebalance your portfolio, you need to put time into plotting economic activity versus price inflation rate. Fortunately, this is easy to do on a monthly basis. Good sources to find the data needed to know where you are in the above matrix are, first, for economic activity see the “US Economic Activity” figure[xii]. This long-term graph puts the accelerating rate of change in perspective.

Second, for inflation Rate see the “US Inflation Rate History” figure[xiii]. As a note, the average annual inflation rate since the government began tracking it in 1913 through 2020 was 3.1%[xiv]. This long-term inflation rate average is often used in financial planning calculations.

To visualize the shorter-term Economic Activity and Inflation in more detail download the excel file available from the Bureau of Economic Analysis[xv]. Note that from this site you can download the excel table and then use conditional formatting by row to color code economic activity and inflation changes for easy visibility. An example is shown in the “US Economic Activity and Inflation” figure.

US Economic Activity and Inflation
Using current data from the above resources, you can identify which Gavekal Quadrant you are in and anticipate which you are moving into. The Quadrants indicate which investment classes will generate the best returns in each environment and so your assets classes should be reallocated accordingly. Note that these movements are slow, with occasional jumps, so a good reallocation strategy is to move only a fraction of the total reallocation each month over the course several weeks. The trick of course is that in order to make good investment decisions its best to be a little ahead of the market which means having the ability to forecast where economic activity and prices will be a little bit in the future. How to do this is covered in the sections below.
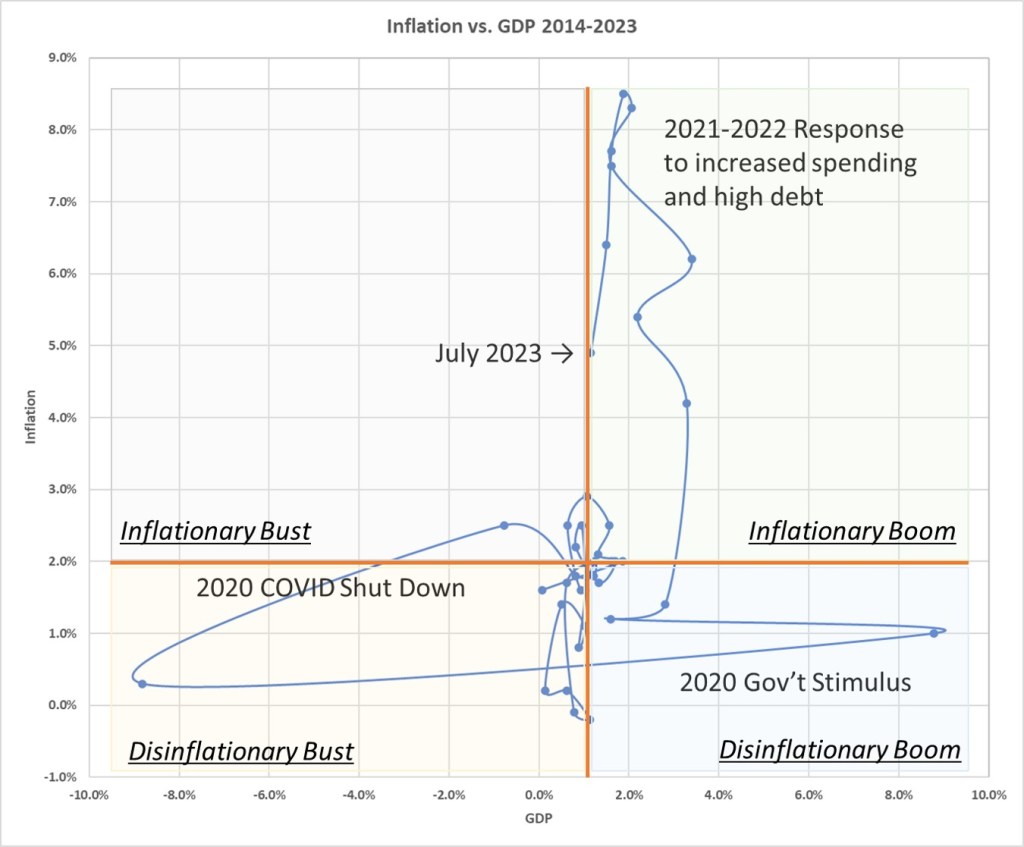
If you are good with excel and like seeing pictures of economic conditions, plot the US Economic Activity, i.e., Total Gross Domestic Product (GDP), versus the US inflation rates, on an x-y scatter plot. Such a plot, the “Inflation vs. GDP” figure, shows the pathway the economy has moved through the four Gavekal quadrants between 1956 and 2023. The orange lines show the average values over this period and are used to delineate the four Quadrants.

Note that as the introductory paragraph on the Gavekal framework mentioned, the US tends to spend most of its time alternating between disinflationary booms and busts, which make inherent sense as the dominant force of capitalism is deflation. There are however excursions into the high inflation quadrants. One was during the 1980’s and the other wild swings were the 2019 COVID crisis and government response. This effect can be seen better when only the pathway of the economy between 2014 and 2023 is plotted. The orange lines show the average for the GDP over this period and the 2% target inflation rate of the 2023 FED Board.
Impact: Investing and upgrading assets that you will hold for a decade or more, i.e., cars, real estate, partnerships, etc., should be acquired consistent with a Country’s Inflation and Economic Activity Indicators. The best time to purchase these assets is when a country is the Disinflationary Bust Quadrant.
Techniques for Rebalancing Bucket #1 Consistent with a Country’s Inflation and Economic Activity Indicators
For completeness, just a quick note on Bucket #1. Note that this Bucket during your employment years is kept at 6 months of net salary. It needs to be completely liquid and available on demand daily. As such it is always invested in FDIC insured checking and savings accounts, as well as 3- or 6-month laddered FDIC insured CDs. In retirement the same is true, but since the timeframe extends to seven years, the laddered CD’s can be extended to 12-month, 24-month, or longer durations (to get a little better interest rate), just so long as the laddering always moves money into the FDIC insured checking and savings accounts in time to keep them fully funded for monthly expenses. Thus “reallocation” is simply achieved by constant reinvestment of CD funds when one CD matures and is rolled into another CD or the Checking account.
Impact: Since the goal of rebalancing Bucket #1 is to keep these assets free of all but the slightest risk, keep Bucket #1 assets invested in FDIC insured instruments and accounts.
Techniques for Rebalancing Bucket #2 Consistent with a Country’s Inflation and Economic Activity Indicators
Because of the time horizon of bucket #2, rebalancing is more important than Bucket #1, but not as important as it is for bucket #3. However, there are times when the economy really shifts and as that happens rebalancing is important. In this sense rebalancing is probably only done semi-annually, or when the interest rate changes on the order of a half a percent or more.
The goal of rebalancing Bucket #2 is to earn 3% above the rate of inflation. This is easy to do if interest levels are historically high and inflation is lower or falling. This is because government bonds accessible to all investors can return sufficient interest to meet this requirement. The goal is very difficult to obtain if interest levels are at historic low levels or when interest rates are rising or expected to rise based on inflation and employment data.
In this second environment Alternative Investment products are the few that can be successful. Unfortunately, these are typically available only to Accredited Investors (SEC requirement) with assets in the millions (excluding primary residence). Be very aware however that these assets do carry more risk than is typical for Bucket #2 assets, and evaluate any Bucket #2 asset investment based on risk to principle over its rate of return. This is a critical point! No amount of extra return is worth losing the principle. You are better off using Bucket #1 investment type investments with little or no interest, than taking on risk in Bucket #2 just to make a little more interest. Because of the shorter time frame of Bucket #2 investments, that little extra return does not generate enough value at a macro level to jeopardize your whole financial plan.
Typical investments for Bucket #2 are Government backed CD’s / Treasuries / Bonds. All bonds should be purchased when the bond market is at historic high interest levels and during the falling part of the interest rate cycle when their value is appreciating. No bonds should be purchased at historic low interest levels or when interest rates are rising or expected to rise based on inflation and employment data.
Guidelines for when to invest in which investment asset are derived from the FED Rate[xvi], Inflation[xvii] and Unemployment Trends[xviii] figure. The guidelines themselves are given in the FED Rate, Inflation and Unemployment Matrix.

The FED rate, Inflation and Unemployment numbers are all readily available. The Inflation rate was referenced above. The FED rate us available from the New York FED Reserve Bank[xix] and the Unemployment numbers are available from the St. Louis FED[xx].

The FED Rate, Inflation and Unemployment Matrix provides the following advice during your employment phase of life, i.e., Government backed CD’s / Treasuries / Bonds maturity periods up to two to three years is appropriate, when the interest rate cycle appears to be falling, or have that many years left before it starts to rise again. These assets can be used to lock up a higher interest rate if you think they are headed lower. If you are unsure of the future and want to ride the current rates for period with little risk, use Federal Reserve Fund ETF’s. Note that in retirement it is better to be safer and use one-to-two-year maturities to reduce risk. This is because the short-term cycles typically stay only a year or two in each Quadrant. It is a good strategy to invest in 12-month CD’s / Treasuries / Bonds and ladder/reinvest them, as longer maturities will have you locked up in the wrong investment type as the Quadrant positions rotate. You will give up a little interest premium with the shorter maturities, but for Bucket #2 this is OK because risk reduction is the driver for this Bucket.
When purchasing any government bond, be sure to do it based on its current return to maturity. You want to plan to hold the bond for that full time duration. Holding until maturity meets the Bucket #2 criteria of taking little risk. Do buy individual bonds. Do not buy government bond funds for Bucket #2 because a bond fund’s value varies with the market price and your return is based not on the fixed interest rate, but the market value of the bonds in the funds, which are constantly being bought/sold. With respect to selling a bond prior to maturity, you must carefully watch the interest rate changes that other investors think the FED will make, and beat them to buying/selling (reallocating your portfolio) before they do, i.e., trading not investing. This is a challenge, so investing in an individual bond and holding until its maturity makes more sense for most investors. This way you know for certain what your return will be and you do not have to second guess which way the FED will move.
When the interest rate changes are large, bucket #2 investments that can be moved around without penalty should be evaluated for better opportunities in the new environment. Also, as interest rates get to the top of historic averages, they should be locked in for longer periods of time. When interest rates and inflation are at historic lows, moving 20% of the total assets for investment into gold in preparation for rising economic activity and thus higher inflation followed by rising interest rates should be considered.
Other Bucket #2 investments include Variable Annuities, Fixed Annuities, and Tax Deferred Fixed Annuities. These types of investments used to make sense when insurance companies could offer small investors annuities that provided guaranteed rates. Over the decades this has changed as more and more ETF’s have been formed to get around the SEC Accredited Investor requirement. As such, the rates of return from Annuities only make sense if (1) you do not have time to reallocate your Bucket #2 investments, (2) you do not understand the reallocation principles in the above Inflation / Unemployment Four Quadrants Model for Bucket #2 Assets figure, or (3) you do not feel comfortable managing your own assets (for mental capability decline in old age). In these cases, having your principle protected and guaranteed to be returned to you as a minimum, and with the upside of some fixed interest rate or economic activity related bonus (usually done by indexing returns to stock market performance) can make sense.
Impact: Use the FED Rate, Inflation and Unemployment Matrix to select which type and maturity of government bonds to purchase when reallocating Bucket #2 assets.
Techniques for Rebalancing Bucket #3 Consistent with a Country’s Inflation and Economic Activity Indicators
BACKGROUND: Because the time horizon of bucket #3 is over ten years, rebalancing is done to achieve the highest return possible consistent with you being able to sleep at night. If you wake up anxious or worried you have taken on too much risk. Investors, not traders, know that money cannot buy them happiness, so they are content to have their Bucket #3 investment earn a return in a way that allows them to enjoy the other activities in life that bring peace, serenity, happiness, and a rich life experience.
The goal of rebalancing Bucket #3 is to earn 7% above the rate of inflation. This is a stretch goal because the financial planners and analysts have done a lot of actuarial science around the average return you should expect on your investments so you can best prepare for retirement. What they find is “8% annual return on your investments” is a common number used to plan for retirement. However, this is the rate of return before inflation has been considered. Above it was mentioned that the historic inflation rate was 3% annually, so the 8% total return is really 5% total return after inflation. Thus, 7% after inflation is an achievable, but difficult goal for investors.
Additionally, depending upon in which decade investments are made, there is a chance that you might not hit that 8% number for a bunch of reasons, not the least of which is politics. It may turn out that actual returns are lower. That realized returns are lower than theoretical returns are due in part to people not being able to help but engage in some market timing (trading) behaviors.
To achieve a 7% above inflation rate return, rebalancing is necessary so your investments take advantage of the Dalio Cycles described above. In addition, bonds are included in Bucket #3 investments when the market conditions favor their returns over stocks. Do not however confuse bonds you may have in Bucket #2 investments with those we will now include in our Bucket #3 allocations. Keep the Bucket’s assets separate!
For the money you have allocated to Bucket #3 investments, consider the types of investments defined below, and some guidelines on how to hold them, i.e., as individual assets, as a fund of assets, etc.
Types of Bucket #3 investments:
How to Hold Assets: Background: Keep all your Bucket #3 investments in a brokerage account held by a single entity, i.e., Fidelity, Vanguard, Schwab, etc. Pick one based on its low or no cost and its analytic capabilities to track your investments and research new investments. I have migrated to the Fidelity platform and find it satisfactory. Also, hold all the assets you can as an IRA. Roth IRAs today are much preferred over the Traditional IRAs because of the tax consequence when withdrawn, and the likelihood that because of inflation and tax increases over time, the tax hit will be greater for the Traditional IRA. IRAs also have the paperwork advantage of not being reported to the IRS each year, so as you rebalance and switch positions according to the Detailed Gaval Four Quadrant Model you do not have to fill out any IRS paperwork until the IRA is liquidated.
How to Hold Assets: Government Reserve ETFs: These ETFs serve as you cash account for idle monies waiting for investment. They are fully liquid so you can withdraw any amount at any time to make your other investments. Depending upon your balance you can have this money held in a Government Reserve ETF that pays just below the FED rate of interest. So, you get pretty much the rate of a CD without the true FDIC insurance, but at least held in very secure US Government Bills and Bonds. .
How to Hold Assets: Annuities/Penson Plans: These are NOT investments you would normally make for Bucket #3, but sometimes they are acquired from inheritances, company retirement programs, etc. I list them for Bucket #3 because they are typically illiquid (very defined withdrawal conditions) and higher commissions that reduce your returns. These should be liquidated as their penalty-free withdrawl dates, market conditions, and your age in retirement dictates. Be sure to look at the tax consequences of liquidation, especially if acquired via an inheritance. The basis amount that the tax will be calculated upon will be shown/defined in the annuity/pension contract. Sometimes it makes sense to keep them, or pass them onto heirs, because of the tax consequences.
How to Hold Assets: Stock Options: These investments are normally acquired from company stock option plans. I list them for Bucket #3 because they are typically illiquid (very defined withdrawal conditions) and have significant tax consequences (when exercised). These should be liquidated as your employment status, market conditions or your age in retirement dictates. Be sure to look at the tax consequences of liquidation. The basis amount that the tax will be calculated upon will be shown/defined in the option aware/contract. Be mindful of both the first date upon which they can be exercised, and the last date upon which the options expire worthless!
How to Hold Assets: Stocks: This is the most common type of investment type used in Bucket #3. The best way to purchase stocks is via a no-fee ETF. These are tailored to various markets and market sectors covered in the Detailed Gaval Four Quadrant Model. This reduces your cost, gives you the ability to reallocate you positions daily, and provides diversification compared to owning single stocks. The very best way to purchase stocks is by “constant dollar investing”! When you want to purchase stocks in retirement, or during employment outside of your “constant dollar investing” process, you determine the size of the stock purchase you wish to make, then instead of buying the stock all at once you instead purchase over four weeks in equal dollar amounts each week. That way you get the advantage of seeing if your strategy is right at the end of each week. If the price of the stock is rising, and the assumptions (see Detailed Gaval Four Quadrant Model) say you should still be investing are ok and that you should still purchase is correct, you keep adding to your stock position over the four weeks. If the price of the stock is falling you can either reconsider if the assumptions say you should still be investing are ok and that you should still purchase is correct (see Detailed Gaval Four Quadrant Model), you keep adding to your stock position at an even better price, or if those assumptions have changed you stop your purchases over the four weeks. You might think that a change in the market is going to occur faster than four weeks, but if so, you are a Trader and not an Investor. That is ok when the situation warrants, however almost every time I have tried this, I have not been successful in timing the market and regretted my choice. This concept is backed up by a famous Trader[xxi] during the last century. He still gets quoted today as having principles that have withstood the test of time and the markets.
How to Hold Assets: Bonds: In Bucket #2 high quality individual government bonds were purchased and held to maturity. In Bucket #3 you can use either Government or Corporate bonds. As Corporate bonds typically pay higher than Government Bonds and Bills, it can pay to use Corporate Bonds when the risk of defaults is low for Bucket #3. Such is the case when interest rates have been high and are moving lower. In this case make sure the bond is not callable, as you want to have locked in you higher interest rate for the full period. You are safer from bankruptcies when the rates fall because the company can refinance at a lower rate and make money (or save/spend the differential cash it makes on refinancing). You are in more danger when interest rates are at their lowest level and/or rising as companies are at risk for having to refinance at higher rates and if their business model is not on a solid footing, they are very susceptible to default.
Always by A rated corporate bonds. Any extra interest you might get from lower rated bonds is not worth the risk. If you want to buy lower rated (junk) bonds consider them as speculative Bucket #3 assets and account for them as such. I have never found junk bonds to be the best place to invest in. Remember the advice is to build a secure financial future, i.e., from investments, not speculation.
How to Hold Assets: Real Estate: Real Estate for investing purposes excludes your primary residence! It includes any second vacation or rental homes/condos/properties and any REIT fund investments. It also includes any Real Estate Partnerships that may be available to you once your net worth is high enough to qualify you as an SEC Accredited Investor. For retirement planning purposes you can include in your retirement calculations the value of your current home if you subtract from that amount the money it would take to move into a new home (total costs of selling, buying, moving, taxes, commissions, fix-up, etc.) My own and many friends and colleagues experience is that owning a second home for income generating purposes is a break-even proposition. This is because if you consider the time, commissions, and upkeep efforts you come out close to break even if your property is lucky enough to increase in value over the rate of inflation. As such I do not recommend these assets for investment purposes. There are easier, less anxious, ways to make money. If rental properties are purchased, you can list them as a Bucket #3 asset, but only keep them if you are getting a psychic return from ownership. REIT Funds are a good diversified way to hold real estate if you are not an accredited investor. My own recommendation is to avoid real estate investments until you find one that meets the requirements of a well-researched real estate partnership. Look closely at the track record, over ten years, of the general partner, and the level of guaranteed returns that go to the general partner over the limited investor partners like yourself. Make sure the General Partner has a big stake in the arrangement and takes his fees last in line, without getting his management expenses paid out before you. Also carefully look at the liquidity provisions of the partnership. Many require holding periods, and others that offer liquidity have provisions that if too many people try to cash out at once, they only get a portion of their request fulfilled. Good partnerships are hard to find!
How to Hold Assets: Commodities: These assets are much easier to purchase via an ETF, versus holding/storing them yourself. The commissions/fees and storage costs/risks are not worth the effort of physical possession. If the world has deteriorated to the point wherein physical possession is advantageous, you should immediately move to a new geographic location! At that point you are likely in a present/future life/death situation.
How to Hold Assets: Alternative Investments: These are usually held via an ETF or limited partnership. They require SEC Accredited Investor status. As with the comments on real estate partnerships avoid alternative investments until you find a broker or partner that meets the requirements of a well-researched alternative investment partnership. Look closely at the track record, over ten years, of the general partner, and the level of guaranteed returns that go to the general partner over the limited investor partners like yourself. Make sure the General Partner has a big stake in the arrangement and takes his fees last in line, without getting his management expenses paid out before you. Also carefully look at the liquidity provisions of the partnership. Many require holding periods, and others that offer liquidity have provisions that if too many people try to cash out at once, they only get a portion of their request fulfilled. Once again, good partnerships are hard to find!
How to Hold Assets: Business Ownerships/Partnerships: These are held by contract or by shares of founders, preferred or common stock. Since these investments, usually obtained by providing time versus cash investments, are hard to value, it is best for planning to list them on the Bucket #3 list, but to value them at zero. It can be a pleasant surprise if they turn out to provide a cash-out, but it is best to take any excess earnings of a business you own, or are a partner in, annually. It is not recommended to leave the excess earnings in the partnership. The legal form of a S-Corporation has many tax advantages and should be investigated if you engage in your own business. The differences between an S-Corporation and a Limited Liability Partnership or Corporation vary by state, so talk to knowledgeable legal and financial advisors when making such choices.
Tools for Reallocation of Bucket #3 Assets
As Dalio Cycles unfold, the different phases of each cycle favor increased or decreased returns in each of the asset classes described above. The goal of rebalancing Bucket #3 assets is to improve the total return you obtain on your Bucket #3 by rotating / rebalancing which assets classes you possess as the Short-Term Dalio Cycle evolves. This is usually done monthly with those above assets classes that are liquid.
Of all the possible assets to hold for Bucket #3, holding stocks is the number one choice. This is because there is a large liquid market, allowing reallocation to be easier than for many of the other asset categories. The other key reason for holding stocks is that over the years, stocks tend to be one of the best performing asset categories. Therefore, we will focus on holding stocks as the primary Bucket #3 assets.
Impact: During your employment years of your life the best way to build Bucket #3 assets is to have a constant amount of your paycheck taken out and deposited into your brokerage account with the default mode to put those monies into purchasing Stock assets. This is because a diversified stock EFT, like the S&P 500 or NASDAC QQQ, will reflect the performance of the largest (and therefore typically most resistant to market shocks and corporate management errors). Just putting the money you allocate to Bucket #3 into a stock fund each month, up until you retire, is probably one of the simplest and best building blocks to improve your financial security. This is a very good strategy when the market is in an overall upward trend that is being aided by lowering FED interest rates. Such was the case between 1950-1965, 1980-1998 and 2009-2020, as shown in the “Dow Long Range Trend” figure green lines. Note that the vertical scale is logarithmic which makes the overall patterns much easier to see. Note too that because of the long x-axis timescale, daily and weekly fluctuations are ”hidden.”

But how to know when the flat “orange lines” are coming, and thus to know when to sell your stock assets? Looking closer at the last 10 years, and focusing on quarterly average trendline the pattern is easier to see from an “investors” view. This is illustrated in the “100-day DOW Average Trendline” figure. When the trendline crosses the current stock price, it is taken as a signal to sell your stocks and get a better return in another asset. Note that “trader” will take advantage of all the variations/noise/volatility in the market, but looking at a trendline gives an “investor” an indication of when to move into and out of the market. To keep a longer-term ‘investors” strategy, yet take advantage being out of the stock market when it is not generating financial returns, many “investors” use a 100-day moving average trendline to know when to buy and sell stocks, moving the proceeds upon selling into other non-stock assets. This method, although good, is not the best, which will be covered below.

Taking advantage of moving trend lines, a simple method to know when to move in and out of a market as an “investor” is the following. Using the closing price of the S&P500, make a 12-month trailing rolling average price from the first day of each month’s closing price of the S&P500 index. Also, for the same day obtain the published FED Fund rate. Comparing these two numbers, move available Bucket #3 assets into stocks whenever the S&P rolling average for the month is larger than the FED Fund rate. Conversely, whenever the FED Fund rate is larger, move available Bucket #3 assets into short-term, 1 month or shorter, Government Reserve Fund ETF’s. A graphic display of these variables is shown in the Investor Reallocation Method figure. Note that the S&P Price in this graphic is for reference, but not to scale.

Using this method, if in 1985 a person invested $10,000, the returns to that portfolio over the period 1985-2023 would have been significantly larger than if the money had just been left in either Government Bonds or S&P500 Index stocks alone. So, for this period an “investor” could have exceeded the Bucket #3 requirement of 7% after inflation. This method appears to work and take advantage of the short-tern Dalio cycles and productivity improvements over the long-term. The caveat is that in looking at the Dalio long-term / Four-Turnings cycle this process favors working in the “Awakening” and “Unraveling” phases. When testing the model in the 1930’s “Crisis” phase it worked too, but the total returns were only marginally better than holding stocks alone. It is uncertain if that performance will repeat again in the 2020’s “Crisis” phase as the FED posture and congressional spending is much different.

Note that there are other “trading” guidelines that will get you in/out of the market on with much shorter cycles and potentially result in better long-term returns[xxii], but I do not recommend them for two reasons. They require (1) more than a few hours a month to execute, and (2) the returns can be quite variable over the span of a year and this is hard for especially a retiree to deal with emotionally. With respect to the latter point, the Investor Reallocation Method described above also has sporadic monthly losses (two 4-month long losing strings, and several 3-month long losing strings over the 1985-2023 period). Again, preferred are patterns and behaviors for an “investor’s” for peace of mind and adequate returns to fund the Bucket model. Unfortunately, Bucket #3 must take some risk in order to achieve its growth goal. There is no risk-free way to obtain a greater than a 7% return after inflation. Note when selling/buying stocks it is best to only buy/sell 25% of the total amount to be transferred every two days and avoid buying/selling on those days where the market is going against the buy/sell indicator. This allows you to take advantage, or not get hurt by, an unfortunate daily swing in prices.


Now the next question is what to do about those periods of time when the stock market goes sideways with lots of variability but no real change in value. It would be nice to reallocate the stock investment into something else that would generate a better return during those periods of time. The common wisdom is to move the stock assets into bond assets, but there are periods of time wherein stock and bond returns are correlated, i.e., move up or down together. Thus, when the stock-bond correlation is negative, the strategy of shifting back and forth between stocks and bonds according the short term Dalio cycles works, but if the correlation is positive, it will not! Over the last 100 years the correlation has shifted as shown in the “Stock/Bond Correlation” figure[xxiii]. Data for the last decade is shown in the second “Recent Stock/Bond Correlation” figure[xxiv]. Also note how poor the correlation coefficient is for many years. Anything under 30% is worthless from an investing standpoint.
Note that shifting from stocks to bonds is a simple and painless in a tax-deferred retirement account, such as a 401(k). If your stocks are in a taxable account and/or if you pay commissions when you buy and sell, buying and selling can be costly and involve paying attention to tax accounting. Thus, hold as many of your Bucket #3 funds in an IRA type account as you can.
The Investor Reallocation Model suggests that when funds are out of the stock market, they be invested in 30-day investments yielding interest at or above the FED Fund rate. Many Government Reserve funds and specialty band CD’s will provide this type of return.
Impact: For overall Bucket #3 investments, the portfolio should always be at least 20% stock (all forms) and 20% bonds (Government or Corporate).
Impact: The remaining 60% of the Bucket #3 portfolio (Swing Balance) can be allocated by the Investor Reallocation Model to switch back and forth from a stock S&P500 Index fund to Government Reserve fund as appropriate. When moving funds, move 25% of the amount every two days, skipping days that are inconsistent with the sell/buy guidance.
Impact: When the economic indicators (GPD and Inflation) suggest the economy is headed into an inflationary boom, other assets listed in the Gavekal matrix, should be used, using the monies from the remaining 60% “Swing Balance” funds. Specifically, up to 20% in real estate outside your primary residence. When this happens in the “Crisis” part of the Four-Turnings cycle, up to 20% gold is also recommended.
[i] https://www.nerdwallet.com/article/investing/stock-trading-vs-investing
[ii] https://www.motilaloswalmf.com/investor-education/5-keys-of-investing/5-key-differences-between-investing-and-trading/
[iii] https://www.outlookmoney.com/fixed-assets/must-know-difference-between-investing-and-trading-2197
[iv] “Principles for Dealing with the Changing World Order: Why Nations Succeed and Fail” by Ray Dalio, Avid Reader Press / Simon & Schuster, Nov. 2021.
[v] The Fourth Turning: What the Cycles of History Tell Us About America’s Next Rendezvous with Destiny by William Strauss and Neil Howe, Crown; Reprint edition, December 29, 1997.
[vi] “The Fourth Turning is Here,” by Neil Howe, Simon & Schuster, July 18, 2023.
[vii] Ray Dalio as published in “Thoughts from the Frontline – The Big Cycle” by John Mauldin, October 7, 2023.
[viii] “The Storm Before the Calm: America’s Discord, the Coming Crisis of the 2020s, and the Triumph Beyond” by George Friedman, Doubleday, February 25, 2020.
[ix] https://populationeducation.org/wp-content/uploads/2020/04/us-population-pyramid-2020-infographic.jpg
[x] “Principles for Dealing with the Changing World Order: Why Nations Succeed and Fail,” by Ray Dalio, Avid Reader Press / Simon & Schuster, Nov. 2021.
[xi] “The Sweet Spot” by David Hay, Whitepaper of Evergreen Gavekal, June 19, 2020, see https://evergreengavekal.com/the-sweet-spot/
[xii] https://tradingeconomics.com/united-states/gdp
[xiii] https://tradingeconomics.com/united-states/inflation-cpi
[xiv] https://inflationdata.com/Inflation/Inflation_Rate/Long_Term_Inflation.asp#:~:text=As%20we%20saw%20the%20Average,since%20they%20began%20keeping%20records
[xv] https://www.bea.gov/news/glance
[xvi] https://fred.stlouisfed.org/series/FEDFUNDS
[xvii] https://inflationdata.com/inflation/Inflation_Rate/HistoricalInflation.aspx
[xviii] https://www.bls.gov/eag/eag.us.htm
[xix] https://www.newyorkfed.org/markets/reference-rates/effr
[xx] https://fred.stlouisfed.org/series/UNRATE
[xxi] “Reminiscences of a Stock Operator,” by Edwin Lefèvre, Wiley, first published in 1923.
[xxii] As an example: Chaikin Analytics, LLC., 201 King of Prussia Rd., Suite 650, Radnor, PA 19087, www.chaikinanalytics.com. Or EWI, PO Box 1618 Gainesville, GA 30503 USA, https://www.elliottwave.com
[xxiii] Ibbotson, PIMCO, Bloomberg, as published in “The Stock-Bond Correlation” by Nicholas Johnson et al, Quantitative Research, November 2013.
[xxiv] “Is the stock-bond correlation positive or negative?” by Peter Mortensen, Russell Investments Group, LLC. Whitepaper, October 26, 2021.
You must be logged in to post a comment.