
The book “Third-Generation R& D, Managing The Link To Corporate Strategy” shared solid strategies to plan when undertaking next-generation projects. This classic book advocated what should really drive R& D and business strategy was a relationship between risk and reward in R&D investments. The most famous graph is shown in the “The Desired Relationship Between Risk And Reward in R&D” figure.

When R&D projects are plotted on such a matrix it is pretty easy to see which ones make the best bets. Everybody loves a high reward low-risk project. The trick however is to decide how to place projects on the grid. The potential reward from the project is oftentimes estimated by marketing from market research. As mentioned earlier many R&D projects fail on commercialization not because they were technically unsuccessful but because they did not achieve the expected marketing predicted returns. This speaks strongly in favor of solid fourth generation and advanced marketing methodologies that we will discuss later. That said when good marketing inputs exist, this graph this graph serves a very useful purpose. For next-generation work it assumes that a company is already in a business and the marketing and product management have a good feel for the benefits in terms of increased market share, profits, and returns to the company that introduction of a new product feature will bring. For R&D organizations, the trick is to place the risk of a project accurately. The methodology used for such an assessment is shown in the “Typical Elements of Project Risk” figure.

In the table shown the units used to assess a project range from words, to numbers, to time, to dollars. This inconsistency of units sometimes causes problems when R& D organizations try to utilize this methodology. An improved method as we see later is to move all these units to an anchored scale (typically either 1-5 or 1-7). An example is shown in the “Project Scoring” figure.
In the example shown we see that each of the criteria is given a weighting factor as well as a rating within that factor. This results in a final score which it is then summed to give a total for each project in the portfolio. The logic is that those projects that score the highest are the best suited to bring forward within R&D. This methodology is used in many organizations with many variants. A deficiency is that this process requires weighting factors. These are much more difficult to ascertain than scoring based on a set of anchored scales. Thus some organizations prefer the latter means to score technology risk elements.

These methods work well for projects that are more in the development versus research phase of exploration. For the latter, as shown in the “Scorecard for Evaluating and Screening Opportunities” figure, it’s important to include the building of knowledge capabilities into the ranking scheme.
The objective of all these planning methods was to tie business needs to technological selection criteria. By the 1990’s being able to make a business case for all R&D projects became an imperative. The work described in third-generation R&D was some of the first on a pathway to improve R&D productivity and results. It facilitated the move from R&D being an isolated function (often characterized at the time as an ivory tower) to one that became an important component of business unit growth.

One variant of the risk vs. reward matrix of the “The Desired Relationship Between Risk And Reward in R&D” figure was developed further by the Monitor Group. They observed that most corporations at that time were heavily focused on incremental “core innovation” to the exclusion of next-generation (adjacent innovation) and breakthrough (transformational innovation). Examples of each category of innovation at that time are shown in the “Types of Innovation” figure.

Using a variant of the Risk vs. Reward matrix, the Monitor Group surveyed companies to determine and display the Average Resource Allocation Ratio (note some industries varied from this average) and the Average Distribution of Returns. Whereas the original wording contained in the “The Desired Relationship Between Risk And Reward in R&D” figure steered companies away from risk, the results from the more recent Monitor Group work shows how important breakthrough work is to long-term corporate success (see the “Risk vs. Reward Matrix Variant and Associated Distribution of Returns” figure).
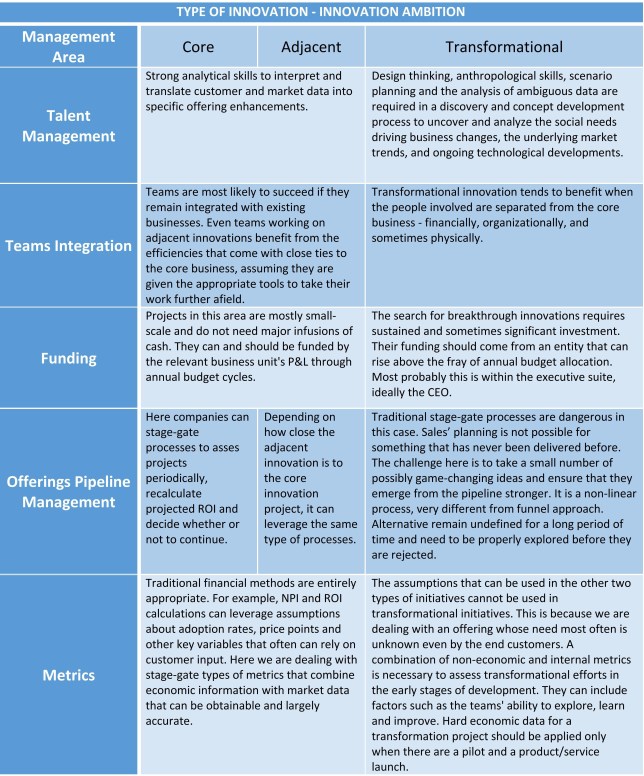
The use of breakthrough projects to enhance a technology strategy seems compelling. It however requires a completely different set of capabilities and processes to be successful. It is this requirement to fund and manage breakthrough ideas differently that presents barriers to incorporation of such projects into technology strategies. These differences are outlined in the “Capabilities and Processes Required of Projects in Technology Strategies” figure.
The need to incorporate next-generation and breakthrough innovations into a company’s technology strategy is an important corporate need. As such more complex approaches to developing an appropriate technology strategy were created. The goal for such approaches was to incorporate more market and technology insights into the technology strategy process, while at the same time reducing the manpower expended to create and explain the results.
You must be logged in to post a comment.