By way of introduction, it’s important that product and technology roadmaps are developed through collaborative efforts of the management, senior business and technical personnel. When roadmaps are the appropriate planning tool they need to be reviewed and updated periodically, typically at least quarterly for most corporations, to ensure that they remain relevant to the changing circumstances and evolving business direction. The strategy must also be built on core competencies that are owned and required to ensure a competitive advantage. The procedures it should be apparent in setting R&D strategy are ones that ensure that, risk reward and stability and growth balance is maintained, resource allocation decisions are appropriate, relevant knowledge is transferred across projects, and previous product and process investments are leveraged.
From technology strategy standpoint the highest business priority to sustain and grow the business at slightly above the industry participants’ average can usually be accomplished from incremental technology or next-generation technology. Identifying gaps typically comes from customer requests, or technology / business road-mapping. Road-mapping either businesses or technologies gives a planning team the sense of where an industry has been and where it is going. It also highlights the rate of change that is going on in an industry segment. The rate of change corresponds directly to the number of technology resources that are likely to be a needed to remain competitive.

Road-mapping corporations and road-mapping technologies have been well researched and published. Examples of road-mapping in the corporation were published by Richard Albright and Thomas Kappel in Research Technology Management, March-April 2003. Their overall process is shown in the “Process of Creating a Technology Roadmap Plan” figure.

Also shown in their paper are experience curves as described in the section above. These experience curves are many times overlooked in technology strategy planning. They are the Moore’s Law for traditional companies. These curves have been constructed for many industry segments and many products and services offerings, and the log-log relationship between the market price per unit and the cumulative units sold turns out to be surprisingly straight lines (see the “Example Experience Curve” figure).
This relationship is particularly important and useful when one goes about planning price and performance targets for incremental new products and services. It is especially useful for an ongoing business. Plotting past history and either a product feature (such packaging peel force for opening) versus time on log paper, it’s apparent whether or not the sales and/or marketing organizations are expressing customer needs that will fit on the experience curve and will be addressed by improve current technology as more experience is gain, or is the sales / marketing request a break from the experience curve and will require a new different technology to satisfy the need. Using this methodology is extremely powerful in the selection of the correct product posture to use at the project level. It is either incremental, next-generation, or breakthrough posture that will be required….and the experience curve tells us which posture has the best chance of a successful business outcome. A common mistake is to assume that an incremental posture is appropriate, and thus approve project plans, fund and resource them at that level and with that strategic intent. Behaving this way, when it is clear that a next-generation or breakthrough is needed, is nothing more than a waste of company resources.


The key element for strategic planning from technology roadmaps is that they highlight technology project options that can be selected depending on the market or environmental triggers that occur. Example technology roadmaps are shown in the “Generic Technology Roadmap” figure, the “Example Cell Phone Technology Roadmap” figure and the “Example Automotive Radio Technology Roadmap” figure.

To get to these roadmaps, oftentimes companies use the intervening step shown in the “Linked Technology – Product Features/function and Market Drivers-Product Features/function Grids” figure. The latter shows decoupling the two matrices of our technology / product function / marketing maps, but for many organizations doing them together with one combined integrated team is more insightful.
Whether the two matrices are done individually or together, the methodology is to have project selection teams score the individual attributes on an anchored scale, one against the other. For example each product feature is ranked against the market driver for importance, as seen from the business and market perspective. Subsequently these product features are used to rank the technology solutions or projects. Each proposed technology solution or project is then rank ordered for its likelihood in delivering the product feature required in the timeframe specified. Combining the two matrices, they become a scoring model that allows ranking the technology solutions or projects against market needs.
Remembering that this process is designed are for incremental changes in product features, and incremental technologies needed to address those new features, this work can be done quickly by experienced teams. Also the degree of error in putting together such matrices is small because both the markets and the technologies are well understood by the evaluating teams.

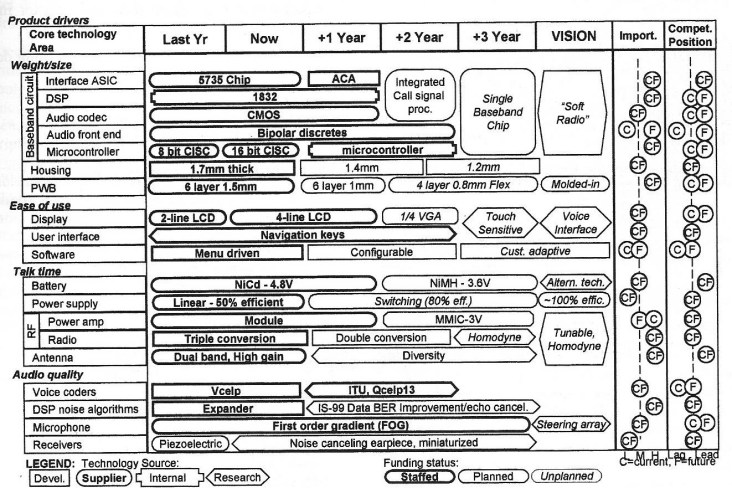
Finalized maps showing technology evolution in a particular area are shown in the “Visual Display of Technology Roadmaps to Senior Management” figure. These integrated maps highlight market triggers, product evolution, technology developments and issues all put together in one picture. Such roadmaps are often good for individual business units but for large corporations such tools tend to be cumbersome when presented to senior management teams. As a result, a summarizing methodology is more appropriate as will be shown later.
In “Starting-Up Road-mapping Fast” the case was made for using technology and business roadmaps to improve customer relationships. Road-maps allow for better communication regarding how a company is going about meeting the requirements placed by key customers. Road-maps also strengthen the business engineering interface. They create a clear product / technology vision and strategy. The improvement in communications that results more than pays back the effort required to undertake such detailed planning.
Companies using Road-mapping methodology are usually manufacturers of large systems where the components need to be integrated in a particular time frame. Planning in this way, based off of trigger points, improves time-to-market and allows a team to look far enough ahead to define future products and their entry points. Clearly such methods do not work for companies were future next-generation or breakthrough products can’t yet be defined. But when used for incremental new product planning, this methodology allows for quicker “out of the gate” alignment, highlights critical technology developments, and how to get the critical developments off of the overall program-critical path (so the overall system is delivered on time and the contingency for component development failure is accounted for). These maps also provide real opportunities to identify where partnerships and Open-Innovation can play a key role.

Some planning tools put in a matrix “products versus technologies”. This matrix is shown in the “Relating a Product Technology Matrix to Technology Roadmaps” figure.
In traditional strategic planning these for matrix quadrants are divided up by priority. However, what is shown in the “Relating a Product Technology Matrix to Technology Roadmaps” figure is how a technology roadmap reconciles the priorities set for different programs that fall in the different quadrants of the matrix over time. In this graphic display rather than prioritizing Phase 1 then Phase 2 then Phase 3 then Phase 4 in doing projects, the technology roadmap reconciles the priorities and shows how they should each be undertaken over time. Further, as time progresses the appropriateness of the technology can be re-evaluated. This simple matrix can be used to identify the Phase of each project on a roadmap, and if so color coded and put on a road map that shows flow over time a much more powerful planning and communication tool results.

The other feature of road-mapping is that it helps illustrate a vision of the future. The simple easy-to-understand graphic of a roadmap shows how everyone in an organization can contribute over time. In the “Generic Roadmap Architecture” figure, essentially the whole value chain surrounding the company or product is mapped so that additionally complicated interrelationships and competitive positions are easily seen. The roadmaps also help visualize how products and technologies evolve, and thus allow senior management to see why some technology options must be pursued in a simultaneous manner.


Reporting progress on technology roadmaps to senior management is sometimes best done by simplifying the graphic display. This can be done by only showing the technology progress of a single unit, a company, or an industry segment. Examples are shown in the “Simplified Technology Roadmap Example of Pressure Sensitive Adhesive Release Technology” figure and the “Simplified Technology Roadmap Example of Electric Heaters from Conductive Polymer Materials” figure.
The “Simplified Technology Roadmap Example of Pressure Sensitive Adhesive Release Technology” figure shows how release technology for pressure sensitive adhesives in the 1990s shifted from solvent based systems to those using water emulsions and then on to systems without solvents that required no removal of a volatile material. It also shows the final progress of the technology to a solution that didn’t require a release coated backing strip at all.
The “Simplified Technology Roadmap Example of Electric Heaters from Conductive Polymer Materials” figure shows how a company developed electrical heaters over a number of years in the 1970s. Although the example is old, it is still true today that senior management teams can grasp much faster than other displays of such information the concept of a tree with products growing from its branches, and the technologies supporting them growing downward from the roots. Transforming traditional technology roadmaps into graphic displays that have physical meaning is a useful exercise for most senior managers and director board members. In this example in each of the product lines are shown as buds growing off the tree limbs and successful product will launches are shown as flowers. Underneath, the elements of the root system to show the technology’s progress over time.


From a strategic planning process standpoint building roadmaps is usually done with cross functional teams. Two such generalized processes from different authors are shown in the “Example Process to Create Technology Roadmaps” figure and the “Example Process for Technology Roadmapping” figure.
The common elements in setting up the process include looking for information from outside sources and understanding market trends through voice-of-the-customer gap analysis. This is followed by looking carefully at the near-term product needs and product strategy. Groups work to construct roadmaps looking at the technology solutions and then linking the technology resources to customer needs (that are projected to evolve over time). The last step is of course to envision the future and make sure that the technology roadmap meets the company’s strategic intent and strategic architecture as discussed above.
For companies that are faced with incremental and next-generation product development that takes place over an extended period time, technology road-mapping is a powerful planning tool. Companies inappropriately shy away from using such a process however because for companies that haven’t used it before, this process seems like it would take a long time and could be cumbersome. In fact, under guidance from trained facilitators, these processes usually can be done in three to four half-day or day long planning sessions. Thus extremely valuable output can be obtained for very little input time.
Embedded in the technology road-mapping process is a strategic project selection process. For all the project ideas in a given area that have come out of the ideation methodologies described above, these projects are initially laid upon the technology roadmap plan. In doing so the planning teams are doing two things. They’re looking at when the technology might be needed. They’re also subconsciously looking at when the technology might be available through the funded work of the project.
Technology road-mapping teams discard projects for which the technology would not be ready in time. The teams favor those development programs where the technology placed on the technology roadmap drives the whole system forward through its commercialization cycle ahead of competition. For industries that are very capital-intensive even more sophisticated models are appropriate to use. These involve the use of complex decision trees where the elements of a technology roadmap are tied together and each is assigned a probability of occurrence and a probability of technical success given occurrence. The strategic Decisions Group (SDG) located in Menlo Park, California has developed software and refined this complex process significantly over the past decades. Their methodology is to build detailed decision trees, collecting the probabilities needed for each branch of this tree in a time effective manner, and then look at overall probability of occurrence of different scenarios. They and others have refined such scenario planning to incorporate Monte Carlo simulations that allow application of probability distributions to the choices to be made at each gate.
The decision tree methodology is further refined by the use of real option choices to be made each day. Such methods are outlined in the book “Real Options”. Other real option advocates have refined such methodologies so they can be used in specific industry segments. Industry segments best utilizing such decision tree methodology are those that typically involve large capital investments over time or large systems that are comprised of many subsystems (each with their own success and failure probability distributions). Examples are oil exploration, oil production, aircraft and spacecraft systems, and telecommunications infrastructure. Because of the amount of the investment in the overall system is so large, coupled with the fact that the probability distribution of success at the component or subsystem level can be predicted with some accuracy, and allows his methodology to be used well.
Industries that have rapid cycle times such as computer gaming, cell phone technologies, etc. are not good candidates for these methods. In these industries the assumptions that go into the Decision Tree Gates are poorly understood. The probability distribution of success or failure is more of a guess than a fact by all but the most experienced personnel. At this point the approach starts to lend itself better to Delphi technology versus decision trees.
For most company’s the simple technology roadmaps described earlier are more than satisfactory for creating a good technology strategic plan. When uncertainty starts to increase, technology strategic plans are best constructed using the “next-generation” or “Horizon 2” strategic planning tools in the following section.
You must be logged in to post a comment.