
The classic method for evaluating and selecting next-generation products is to look at risk versus reward. The risk is often put in terms of technical difficulty whereas a reward is usually defined as net present value given success. The classic 2 by 2 matrix is shown in the “Technical Difficulty and Commercial Potential” figure.
Reaching an appropriate balance of risk and return involves a trade-off between technical difficulties and commercial potential. Projects with a high probability of success and a low-return-given-success are usually associated with incremental next-generation projects. These are usually what a corporation considers to be the bread and butter or cash-cows of its business and the focus of much of the development teams’ efforts. White elephants below them are ones for which the probability of success as well as the return is going to be low. One hopes that by doing thoughtful strategic project planning to avoid projects falling in this quadrant. The oysters are those with high net present value but low probability of success. They’re called oysters because not all of them have a pearl in them, but if the technology development does come through with a next-generation or breakthrough product, the return is handsome indeed. Last are projects labeled as pearls. These frankly rarely exist because these projects have a high probability of success and also a high return. When they are found they typically consist of (1) systems which are comprised of known components or (2) are projects that take existing technology into new markets (where consumers are ready to purchase). In this model the suggested project distribution is 80/20 between “Bread and Butter” and “Oyster” projects. “White Elephant” and “Pearl” projects are only rarely undertaken.
A slightly more complex product portfolio plan was proposed by Rick Brown. Here instead of using the traditional 2 x 2 matrix of attractiveness versus capability he used a 3 x 3 matrix because it better segments out the pearls, oysters and bread-and-butter projects described above. He believes there are Six Zones.
Zone one has high market attractiveness and high company capability or probability of success. The goal here is to build volume. The strategy is to expand the market by converting non-users or increasing usage rate. Another alternative is to grain market share by winning competitors’ customers.
Zone two has a moderate to low market attractiveness but high company capability. The strategy here is to hold what the firm already has. This takes the form of defending share by maintaining customer value, maintaining communications presence or brand, and continuing product improvement. It’s about defending margins, reducing costs, reducing investment intensity, and vertical integration.
Zone three has moderate market attractiveness but weak company capability. The strategy here really depends upon competitive analysis: (1) If the market leader is weak, slow or passive, a good strategy is to challenge the leader by investing selectively or by an acquisition. (2) If the leader is strong, responsive or aggressive, and you’re a follower, it is just best to accept the number two status that you have. (3) If your company holds a niche position, it’s to best to specialize further, and focus on unmet consumer needs.
Zone four is characterized by moderate to weak market attractiveness and moderate to weak capability. The strategy here is to harvest. Harvesting can either be done slowly by reducing discretionary expenditures, improving the sales mix, or rationalizing distribution channels. Rapid harvesting involves eliminating discretionary expenditures altogether and raising prices.
Zone 5 and Zone six are really quite unattractive. Zone 5 possesses an unattractive market and weak company capability. The option here is pretty much to terminate the business. This can be done either by liquidation or divestiture.
Going beyond these methods, a portfolio selection usually involves many more matrices as outlined in third-generation R&D discussed above. These matrices have the advantage that they help an organization see which projects are likely to be better than others at producing value for the company in the time frame that it needs. The disadvantage is that by using multiple matrices sometimes a strategic planning team and also senior management loses sight of the “forest” because of its focus on the “trees”. That said, these project methodologies have been proven through the decades to pick projects by corporations in all industries with good success.

The best set of matrices to use when picking R&D project portfolios will now be reviewed. They are typically generated and used for decision-making in the order given. The primary method of picking project priority is shown in the “Primary Project Priority Matrix” figure.
This figure is a traditional risk versus reward matrix. The difference is that it is somewhat quantified. The probability of commercial success is shown on the x axis. Most organizations define this as the multiple of technical success times market success. The y-axis is the reward potential after some time period elapses since the new product is introduced. When projects are mapped on this matrix is clear that the upper right-hand corner is the most desirable (high probability of commercial success and high return to the corporation). This matrix is done first because the results of this matrix typically trump any of the others that follow.

For next-generation products the second project priority setting mechanism is to think about how sustainable the advantage is that RD creates. This will be of value to the corporation as shown in the “Secondary Project Priority Matrix” figure.
This attribute is shown in the vertical access from weak, to strong, to dominant. The cut off points are how long the company will enjoy an exclusive position because of its intellectual property. The first cut-off point is usually a year; the second cut-off is four years. These can be adjusted to match the appropriate life cycle times of the products or services the corporation offers. The x-axis is stated in technical terms. The leftmost column is for incremental R&D. The center column is new platform and new products which is usually next-generation R&D. The right column typically accesses new customers and is achieved through breakthrough R&D. One of the reasons for using this matrix is that it is not uncommon for general managers and marketing managers in mature businesses to fret over declining returns to their businesses, therefore requesting breakthrough projects. When one looks carefully at what the breakthrough would achieve by way of product functionality it is clear that many times it can be reverse engineered, or that the cycle time associated with the with the project would be such that only a weak technology position would be achieved. This is often because such general managers and marketing directors discuss their ideas and concepts with others outside the company. Such disclosure ruins the opportunity for an intellectual property position. As such, projects like this end up in the lower right-hand quadrant. When that happens the best thing to do is abandon such efforts. This matrix, when used in this manner, can be a training tool for such marketing people and general managers.
The priority running across the top row of this matrix is from a stakeholder’s point of view. The first priority is actually to the left rather than to the right. At first glance this may seem counterintuitive. However we think of it as an investor one would always give preference to products which have a high chance of being successful (that is the incremental ones) over those that are more risky but a big breakthrough. Remember that in this case both projects will create a dominant commercial position on launch. Of course the counterclaim to this is that it’s very difficult to get incremental projects done in a way that creates an intellectual property position capable of excluding others for over four years. Such a feat is rarely obtained. However there are times when acquisition of technology outside the corporation can be brought to market. In this case it could then be incremental R&D yet because of a previously established IP position be a dominant technology and commercial position.

The next element when selecting R&D projects is the way in which the project is postured. Posture here is defined as either offensive R&D, defensive R&D, withholding R&D, or a maverick R&D approach. The way in which such choices are made is shown in the “Posture of R&D Projects” figure.
The x-axis in this matrix relates to the relative market share of the company versus that of the next largest competitor. This work was developed by Bain Company. The x-axis runs from being very dominant versus the next largest competitor by holding a two or even three times market share size compared to them. This might be the case of 3M in the area of Post-it notes. Something where the market shares are roughly equivalent might be for instance between Coca-Cola and Pepsi Cola and the soft drink area. Low market shares, typically that of less than 10%, occurs when start-up companies are trying to take new share with a new business model. The vertical axis is created by thinking about the overall market growth rate. This ranges from high-growth products such as consumer games, medium growth telecommunications products such as cell phones, and negative growth products which may be for instance found in commodity grade steel or metals mining. So for example if we take Frito-Lay with a high market share and a medium overall growth rate we see that they should be working on defensive R&D. This is typically incremental R&D designed to keep the company’s share large versus the next largest competitor. In these cases usually brand strength and intellectual property through copyrights and trademarks is more important than that from technology and patents. As such the incremental R&D defensive posture is appropriate. To spend any more would achieve very little because market share is already so large. The effort is only increased when there’s a strong attack from another company.
Offensive R&D is required even at high shares. An example is with Internet companies in the late 1990s, and computer gaming companies in the 2000s. The market is moving so fast that a company must continually reinvent itself and stay tuned to the changing customer and market needs. Here next-generation R&D needs to be funded and it needs to be funded in a consistent constant manner. Even companies that only have a little over one times the market share of their competitors need to have this offensive stance.
The upper right-hand quadrant where there is low market share and high-growth is usually populated by startup companies entering a new market. Here Maverick or Breakthrough R&D is imperative. Again a common flaw in large-company portfolio selection is to think that the company can enter a new market that has a high growth rate by doing next-generation or incremental R&D. This flawed thinking usually comes from an inexperienced product manager or marketing person believing that they’ve identified a consumer feature that can easily be put in place. This may be true, but in high-growth areas lots of companies are going to have that same insight and without a breakthrough approach the companies will remain at a low relative share position. This usually results in poor profitability.
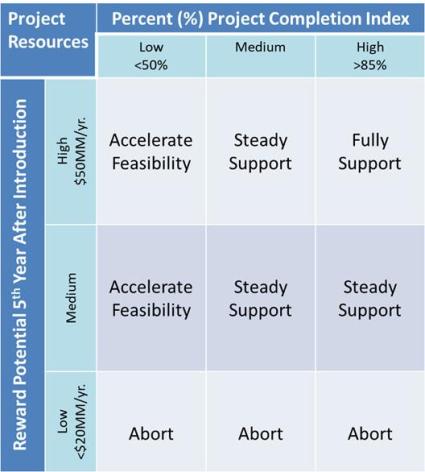
Having picked projects using the first two priorities, and then thinking about the way they are postured, the use of a third matrix leads to the next question of “how heavily to resource the project?“. Later in the integrated intellectual property management section, the IP resources required should also be taken into account. However focusing only on business and technology integration, project resources are calculated based on the company’s return versus how far along the project was. This is shown in the “Project Personnel and Capital Expense Resourcing” figure.
The vertical axis of this matrix was used previously. It is the reward potential for the corporation after product introduction. The x-axis is new. It ranges from a low project completion index between a few percent up to 50%, to a medium project completion index ranging from 50% to 85%, and to finally a high project completion index above 85%. This matrix is put in place because there are times when it is appropriate to evaluate current ongoing projects right along with those that are just entering the system using a zero-based system. This is a means to do so. All projects are put on this matrix and those that are going slowly through the stage gate process are going to show is being in the low to medium completion areas. The quadrants labeled “fully support” and “steady support” relate to staffing those projects at levels consistent with the corporation’s past history of success. “Accelerating Feasibility” is necessary when it is time to figure out whether a project is going to make it to the next gate in a stage gate process or not. “Accelerating Feasibility” often means supplying additional capital expense items, analytical research time and information science support. Putting temporary personnel on the project for a month or a quarter to see if a breakthrough can be made is also a good strategy. If this approached and extra support doesn’t generate a result, it’s time to abort.

When doing business technology management and project selection for R&D projects the question of internal or external sourcing of resources needs to also be considered. The decision matrix that is traditionally used to make these decisions is shown in the “Partnership Decision Matrix” figure.
The x-axis of the “Partnership Decision Matrix” figure has to do with market knowledge. It moves from core markets which are well understood, to those that are new but familiar to the world, to those that are unfamiliar anywhere in the world. The vertical axis is the same for technology knowledge. This knowledge ranges from core technology that the company possesses and can implement easily, to that which is new to the corporation but familiar elsewhere in the world, to that which is unfamiliar to anyone in the world. The lower left-hand quadrants (because of the competence within a corporation) recommend project teams made from members of the company’s staff. Moving to the upper right either by moving to the top or to the right moves the company into partnerships. When moving up it is technology that must be developed with outside technical leaders. Moving across the matrix suggests working with outside market leaders. The upper right quadrant is considered suicide square because it is very rarely that both a new technology and a new market can be created at the same time. If this path is undertaken it is often best to do it by way of an outside venture.
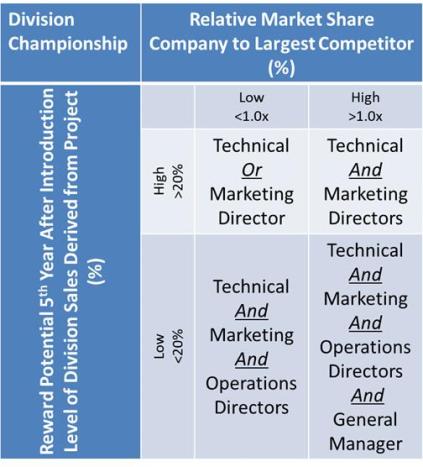
Important in large corporations is the actual champion or owner of the Project. A simple decision matrix is oftentimes helpful. The “Organizational Position of Project Champion” figure shows who the appropriate champion might be within a corporation.
In this “Organizational Position of Project Champion” figure, the x-axis is the relative market share of the company vs. that of its next largest competitor. The vertical axis segments the reward in the fifth year after product introduction. It’s expressed as a share of that division’s sales versus the raw number. Mapping projects on this matrix allows one to see whether it the project should just best be champion by a central R&D, a divisional R&D, a business unit marketing person, or business unit general manager. There are also times when working relationships allow co-championship of a project. If that is the case it is strongly recommended that the corporate culture allows it.

Within technical organizations there can be conflicts when assigning specific individuals to projects. In such cases is useful to use the matrix shown in the “Capability versus Availability” figure to help resolve such conflicts.
The vertical axis in the “Capability versus Availability” figure matrix segments the background knowledge from a technical standpoint that exists within the corporation. In the lower quadrant there really is no in-house expertise, whereas towards a top solid expertise in both a corporate lab as well as in the business unit exists. The x-axis range segments the world’s availability of knowledge (the number of sources from which a person could acquire the technology needed for R&D success). This ranges from many sources that exist in the world to technologies that are newer and unfamiliar (where there are essentially no people willing to share what they know within the world). Mapping projects on this matrix often shows R&D personnel why it is in everybody’s best interest to look outside for R&D support. This can often be used to during budgeting negotiations between senior R&D personnel and general managers. There are times when general managers try and do the work inside because they perceive that it can be done cheaper with no change in their headcount or incremental expenditures that would cause problems for a declining business. This can move the general manager’s thinking to include outside help.

How projects are done and who might be responsible for them can also be helped along by the matrix shown in the “Project Goals” figure. In this matrix the market share strategy is plotted versus the product line needs. This is different from the previous matrices because it’s focused on the strategy from a both a technical and marketing standpoint versus what the actual share is of the current company’s products.

Shown in this figure are the goals the project should have based on product line needs and marketing’s share strategy. This is a good sanity check on the project’s articulated goals, but more importantly, by overlaying on this matrix the appropriate organization to best take on the project to provide leadership adds clarity to the project leaders reporting relationship. This is shown in the “Organization Responsible for Technology Project Management” figure.
In the upper left-hand side of the “Organization Responsible for Technology Project Management” figure we see that when companies are yielding market share it is inappropriate to do any R&D. This is in contrast to the lower right-hand quadrant where the company should try to add new markets with really new products. In this area it is often important to use corporate R&D (or an outside partner if one is available) to create a breakthrough or significant next-generation product. Projects falling in-between are best done by divisions’ applications engineering, product research or applied research personnel.
Using the matrices just discussed, it is often best to make each matrix up all at the same time, and put each one on a single sheet of 8.5” x 11” paper (or alternatively drawn on a large flipchart). These are then placed on a wall (preferably in a war room to be discussed later) and observed from across the table. This allows people to look at the patterns that are being created in each of the matrices and have an open honest discussion about which technology projects are really the best ones to take forward, and which ones are best managed by which of the corporation’s organizations. Individuals conducting such an analysis are best gathered from across the organization. They should involve general management, marketing, technical, manufacturing, and intellectual-property personnel.
The power in these matrices is that many general managers are trained to look at data in tables and charts. Showing projects mapped out in such matrices are visual displays that most seasoned general managers are custom looking at. It’s often said sarcastically that most consulting firms provide everything in 2 x 2 or 3 x 3 matrices. Conducting R&D strategic planning in the same mode has its advantages in being familiar to participants.

An alternative to such methodology is to conduct the same planning by using the Star diagrams discussed earlier. In this methodology the projects that are related to incremental R&D are put together and compared against one another. Those for next-generation and breakthrough R&D are again collected and evaluated separately. The common form is to put on one very large Post-it note or 8.5” x 11” sheet of paper a single star diagram. The methodology for doing project selection using these visual displays, is to layout the Star diagrams on a table with the horizontal axis being the company’s capability (upper left quadrant of the star diagram) and the vertical axis the return to the corporation (lower right quadrant of the Star diagram). A cross functional team begins by moving projects around on the table until everyone agrees that the projects are in about the right spot. This methodology has the advantage in that it is usually quicker to do than the matrices, and in hindsight it has been found that the decision was of a higher quality. Projects selected are those for which the company has both a high capability to conduct and will generate a high reward. An idealized example of such a distribution is shown in the “Idealized Selection of Projects by A Star Map Distribution” figure.

R&D’s “Cycle time reduction” or “time needed to commercialization” are elements not typically covered in the traditional technology and business strategies. Although it can be said that there really isn’t much point in looking at R&D cycle time because everybody wants a project yesterday, explicitly looking at R&D cycle time allows improved R&D performance. Elements of this thought process are shown in the “R&D Cycle Time Reduction” figure.
The world has come a long way with respect to cycle time reduction. Shown in Figure 3.7.61 are the old elements which isolated R&D from business. The methodologies for using technology were have R&D work on a project until it was fully developed and then “thrown over the fence to marketing and manufacturing to make and commercialize”. In the 90s the coupling between the market and the customer was occurring as well as between the business and R&D. Coupling market insight from marketing timelines versus competition allowed R&D to better plan which project should be given priority. By the mid-1990s Quality Functional Deployment (QFD), or Design for Six Sigma processes were taking R&D time into account. Road-mapping methodologies also take time into account. Clearly time forecasts can best be done with incremental projects where things are known, it is more difficult with next-generation and certainly close to impossible for breakthrough technology projects. As such Spiral Development was developed for software and Internet R&D in the late 1990s, and improved upon later with Agile and Lean Development processes in the 2000’s. Open Innovation (discussed later) promised to reduce cycle times still further in the 2000’s, along with providing access to a broader repertoire of existing technologies.
You must be logged in to post a comment.